TL;DR, because this is not a post for cricket casuals:
- Fog in North India in December, heat waves in April, election clashes, and security disruptions are predictable risks, not bad luck.
- Indian cricket continues to treat these as isolated incidents rather than as interconnected system-level risks that cascade across scheduling, logistics, player welfare, and revenue.
- The BCCI now runs a ₹20,000-crore ecosystem, yet lacks a transparent, enterprise-wide risk management framework appropriate to that scale.
- Global sports bodies manage similar uncertainties using formal risk frameworks (e.g., ISO 31000) to decide what risks to avoid, mitigate, insure, or accept.
- Applying ISO 31000 to Indian cricket shows that systematic risk management would cost far less than repeated disruptions, cancellations, and credibility damage.
- At this scale, ad-hoc risk management is not neutral—it is value-destructive.
And now onto the post.
This post has been inspired by watching the BCCI schedule summer matches in tropical South India, and winter season matches in our smoggy chilled North. Watching Indian cricketers roam about in Lucknow against South Africa while wearing pollution masks while broadcasters told us match was delayed due to low visibility conditions made me wonder what other risks BCCI could just avoid, or at least manage better.
These risks are predictable. FogSmog in North India in December isn’t a surprise. Heat waves in April aren’t black swans. Even geopolitical and security disruptions, while unpredictable, follow recognisable patterns. Yet Indian cricket continues to treat these as isolated “incidents” rather than as interconnected risks that can be anticipated, priced, and managed.
This is not about fog or heat. It’s about running a ₹20,000-crore system without an enterprise risk framework. So I’m doing an ISO 31000 evaluation for the BCCI. FOR FREE. Please someone share this with anyone influential in the BCCI.
Here’s a non-comprehensive list of some risk sources and events that can happen. You can skim through it if you like, I know it’s long, which already tells you lots:
| Risk Category | Specific Risk | Example/Evidence | Risk Source | Impact Area |
|---|---|---|---|---|
| Geopolitical & Security | Cross-border conflict/military escalation | IPL 2025 suspension due to India-Pakistan tensions (May 2025)1 | Political/regulatory external context | Tournament suspension, revenue loss, player safety concerns |
| Geopolitical & Security | Communal/religious tensions | Mustafizur Rahman threats from Ujjain religious leaders (Dec 2025);2 | Social/political external context | Player threats, stadium disruptions, player unavailability |
| Geopolitical & Security | Terrorism/security incidents | Potential attack on stadium or traveling teams | Security threat external context | Deaths/injuries, event cancellation, insurance claims |
| Weather & Climate | Dense fog | Lucknow T20I abandoned without a ball (Dec 17, 2025);3 | Natural hazard/environmental | Match cancellation, travel disruptions, schedule compression |
| Weather & Climate | Extreme heat | Player heat exhaustion risks, crowd attendance decline | Environmental/climate change | Player health, match timing changes, spectator safety |
| Weather & Climate | Flooding/waterlogging | Monsoon season pitch damage, venue inaccessibility | Environmental/climate change | Venue unusability, match postponement, ground preparation delays |
| Weather & Climate | Drought | Groundwater depletion affecting pitch maintenance | Environmental/climate change | Pitch quality degradation, venue unusability |
| Weather & Climate | Severe storms/hailstorms | Potential infrastructure damage, match disruption | Environmental natural hazard | Venue damage, match abandonment, spectator safety |
| Operational & Logistics | Flight/travel cancellations | Flights cancelled across northern India(just search it, happens bi-weekly in December) | Transportation system failure | Team travel delays, venue setup issues, player unavailability |
| Operational & Logistics | Equipment/supply disruption | Medical supplies, nutrition goods, cricket equipment delays to venues | Supply chain vulnerability | Player preparation delays, competitive disadvantage, safety risks |
| Operational & Logistics | Transportation of spectators | Mass transit failures, road congestion, parking unavailability | Infrastructure/logistics | Spectator attendance decline, safety concerns, venue capacity underutilization |
| Operational & Logistics | Accommodation unavailability | Limited hotel capacity during tournament, staff housing issues | Supply/demand mismatch | Team comfort degradation, player fatigue, franchise cost overruns |
| Venue & Infrastructure | Poor crowd management systems | Chinnaswamy stampede4 | Operational/design vulnerability | Spectator casualties, reputational damage, regulatory action, venue unusability |
| Venue & Infrastructure | Structural deterioration | Aging concrete, roof damage, electrical system failures | Asset maintenance gap | Venue closure, safety risk, remediation costs |
| Venue & Infrastructure | Inadequate emergency response systems | Poor medical facilities, limited ambulance access, untrained staff | System design gap | Casualties during medical emergencies, litigation |
| Financial | Broadcasting rights disruption | Disney+ Hotstar and Star Sports unable to broadcast during IPL suspension | External event affecting revenue | Revenue loss for franchises/broadcasters (₹crores per day), contractual disputes |
| Financial | Sponsor withdrawal/advertising rate decline | Potential sponsorship cancellations due to event suspension or negative publicity | Market condition/risk perception | Franchise revenue decline, reduced capital for player wages |
| Financial | Insurance claims disputes | Ambiguous “war” and “riot” clauses limiting payout eligibility5 | Contractual/insurance gap | Uncompensated losses during suspension or disruption |
| Financial | Currency fluctuation | Overseas player contracts, broadcast payment variability | Market/exchange rate risk | Player cost increases, sponsor revenue volatility |
| Financial | Franchise profitability uncertainty | Rising costs (venue, insurance, player wages) versus volatile revenue (attendance, viewership) | Business model vulnerability | Franchise owner losses, potential team withdrawal |
| Corruption & Integrity | Match-fixing/spot-fixing | CSK/RR spot-fixing scandal (2013);6 ongoing betting corruption concerns | Criminal/gambling-driven activity | Player bans, franchise suspension, sport integrity damage, legal action |
| Corruption & Integrity | Illegal betting rings | Vast unregulated Indian betting markets with links to match-fixers78 | Criminal enterprise/regulatory gap | Match manipulation, player recruitment to fixing, law enforcement involvement |
| Corruption & Integrity | Umpire/official bribery | Potential fixing of key decisions affecting match outcomes | Corruption risk | Match integrity compromise, game credibility loss |
| Personnel | Key player unavailability | International obligations, injuries, visa issues, political reasons (Mustafizur situation) | Competing objectives/external restrictions | Team competitiveness, schedule disruptions, franchise value impact |
| Personnel | Player health/injury risks | Heat exhaustion, match injuries, stress-related conditions from uncertainty | Physical hazards/psychological stress | Loss of key players, season disruption, franchise financial impact |
| Personnel | Coach/staff turnover | Mid-season departures, conflicts between franchise and coaching staff | HR/organizational risk | Team continuity loss, player morale impact |
| Regulatory | Government restrictions/timeline conflicts | Elections scheduling conflicts with IPL dates;9 security directives impacting match scheduling | Government policy/external political context | Schedule changes, venue restrictions, resource allocation changes |
| Regulatory | Visa/immigration restrictions | Player visa delays, border restrictions preventing team travel | Government/immigration policy | Player unavailability, team incomplete status |
| Regulatory | Tax/regulatory changes | Changing tax levies on sports franchises, regulatory compliance requirements | Government fiscal policy | Franchise cost increases, profitability compression |
| Demand & Market | Fan disengagement/viewership decline | Cancellations and disruptions reduce fan engagement, ticket sales suffer | Market/behavioral shift | Revenue decline, reduced franchise valuations, reduced sponsorship interest |
| Demand & Market | Competitive threat from other entertainment | Social media, gaming, OTT platforms diverting cricket viewers | Technology/market disruption | Declining viewership, reduced sponsorship value, lower ticket sales |
| Demand & Market | Social media backlash/reputational damage | Negative sentiment from cancellations, perceived mismanagement | Communications/perception risk | Brand damage, sponsor pressure, fan retention loss |
| Health & Safety | Pandemic-related restrictions | COVID-like scenarios requiring lockdowns or capacity restrictions | Health emergency/external event | Match cancellation, venue capacity limits, player quarantine requirements |
| Health & Safety | Food/water safety incidents | Contaminated food/water affecting teams or spectators | Health/hygiene risk | Illness outbreaks, regulatory action, liability |
| Health & Safety | Air quality/pollution issues | High pollution affecting visibility, player respiratory health | Environmental hazard | Match visibility issues, player health concerns, match cancellation |
Before diving into solutions, let’s define what we’re actually talking about. ISO 3107310 establishes the vocabulary for various terms used in ISO 31000,11 which is the ISO framework for risk management. According to the frameworks, risk is “the effect of uncertainty on objectives”.
Here,
- Objectives are whatever results the organisation wishes to achieve.
- Effect means a deviation from the expected, whether the deviation is positive, negative, or both;
- Uncertainty occurs from a deficit of information; and
Therefore, risk is a deviation from the aims that an entity is working towards caused due to lack of knowledge about the situations surrounding the objective. The deviation can have a positive or negative outcome, but the deviation means it is still a risk, and leads to risk consequences, or outcomes that affect the objectives.
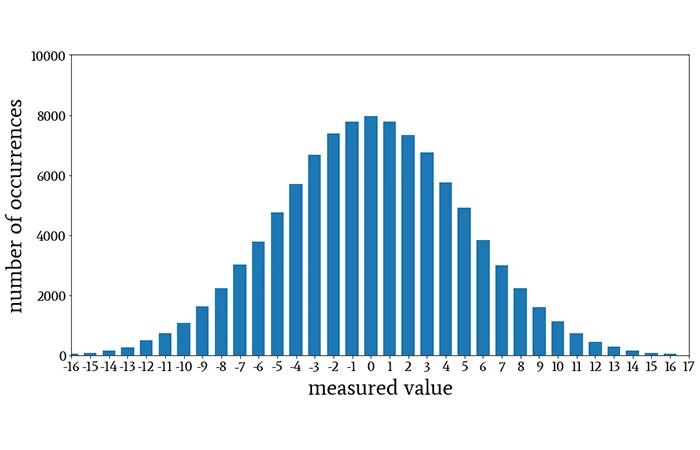
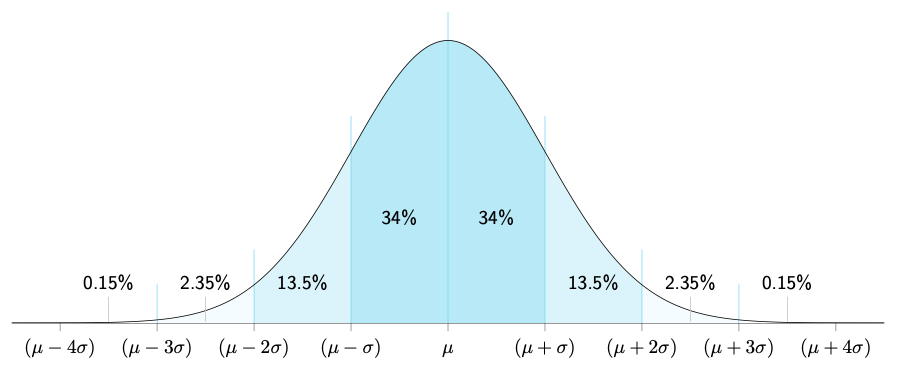
Uncertainty can never be removed entirely. As we see in the normal distribution, risk events can happen even when we are 99.999% certain of our processes. This is called residual risk, or when a risk event occurs even when controls have been applied against the risk source. An event is the occurrence or change of circumstances (the bridge collapses, prices spike, new regulations take effect that can be the source of a risk. A risk source is an element with potential to give rise to risk (think: aging infrastructure, volatile commodity prices, regulatory change). Understanding residual risk is critical for determining whether further treatment is needed or whether the organisation should accept and monitor what remains. It is important to emphasise here that everyone perceives risk differently (risk perception): engineers might see technical risks as manageable; the public might see the same risks as terrifying. Effective risk communication requires understanding these perceptual differences.
The likelihood of an event, is a broad expression of the chance of something happening, and can be expressed qualitatively or quantitatively, but in the previous posts we have understood what a probability is, as expressed between 0 and 1 (here and here), and frequency, which is when we count the number of the type of events we are quantifying. understanding these basic terms helps us understand how vulnerable we are due to our exposure to a source of risk, as well as how to build resilience. Because we’re discussing a standard, these words have specific definitions:
- Vulnerability refers to intrinsic properties creating susceptibility to risk sources.
- Exposure measures the extent to which an organization is subject to an event.
- Resilience captures adaptive capacity in complex, changing environments, so this isn’t about preventing events, it’s about how to recover from them.
Understanding risk also helps organisations understand which risks to accept, and which to defend against. New Zealand’s sports sector adopted ISO 31000 in 2016; Australia’s sporting associations follow it; international sporting events apply it to pandemic preparedness. This is called Risk attitude- the organisation’s overall approach towards risk, and their tendency to pursue, avoid, or accept it. Attitudes towards risk always depend upon any entity’s risk appetite (the amount and type of risk they are willing to accept), and their risk tolerance, which looks at specific risks for each objective. An example of risk appetite is the willingness to invest in innovative technology, and that of risk tolerance is the amount of specific risk an organisation may accept for data breaches in particular.
ISO 31000 Framework for Indian Cricket
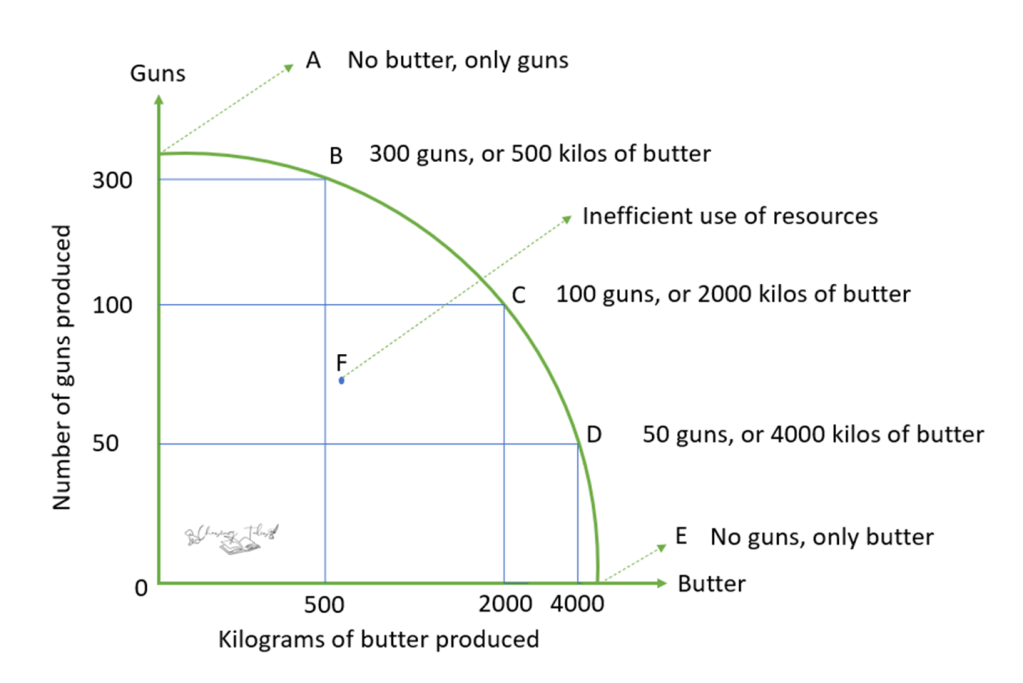
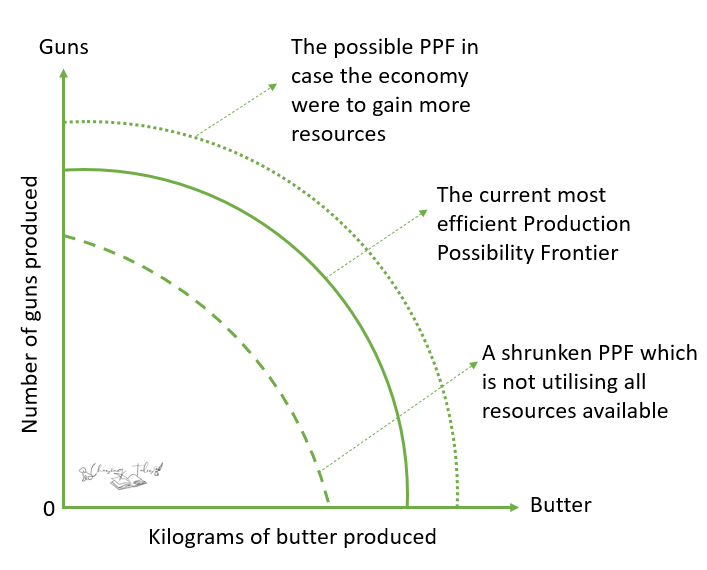
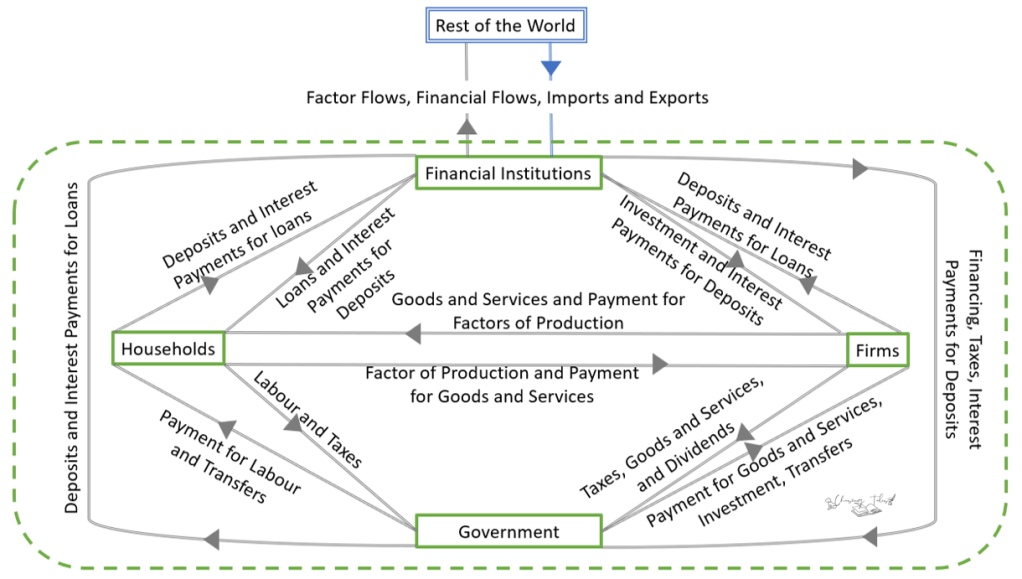
While it may appear that these are all just the costs of doing business in India, I don’t think this is true. Also, other sports systems facing similar uncertainties—pandemics, extreme weather, terrorism, financial volatility—don’t operate this way. They use formal risk management frameworks to decide what to avoid, what to mitigate, what to insure, and what to accept. ISO 31000 is one such framework, and it’s suited to complex, multi-stakeholder systems like Indian cricket. Here it is applied to Indian cricket:
1. Establish Context (Where Are We Playing?)
- External context
- Geopolitics: India–Pakistan tensions, elections, security environment.
- Climate: Fog in North India, heat waves, monsoon, long‑term climate change.
- Market: OTT platforms, competing sports/entertainment, sponsor expectations.
- Internal context
- BCCI governance and decision‑making.
- Franchise finances, contracts, insurance.
- Stadium infrastructure, ground staff capacity, logistics capability.
- Risk criteria
- What level of disruption is acceptable?
- Which risks are “never acceptable” (deaths, match‑fixing, major stampedes)?
- What is the minimum acceptable probability of completing a season as scheduled?
2. Risk Assessment (What Can Go Wrong, How Bad, How Often?)
- Identify risks
- Use the big table: geopolitical, weather, logistics, stadium safety, financial, corruption, personnel, regulatory, demand, health.
- For each, note: risk source → potential event → likely consequences.
- Analyze risks
- Estimate likelihood (e.g. “fog in Lucknow in December” = high; “pandemic lockdown every year” = low).
- Estimate consequence (e.g. “stadium stampede” = catastrophic; “one match fogged off” = moderate).
- Factor in vulnerability (old stadiums, fragile logistics) and resilience (backup plans, cash reserves).
- Evaluate risks
- Plot likelihood × consequence.
- Decide which risks are:
- Intolerable (must be treated immediately).
- Tolerable with treatment (controls and monitoring).
- Acceptable (monitor only).
3. Risk Treatment (What Do We Do About Each Risk?)
For each major risk, choose a treatment option (or a mix):
- Avoid the risk
- Don’t schedule T20Is in dense‑fog cities during December–January.
- Don’t use stadiums that fail minimum structural and crowd‑safety standards.
- Mitigate / reduce the risk
- Upgrade stadium exits, crowd‑control systems, and medical response.
- Build travel redundancy: buffer days, alternative flight routes, backup buses/trains.
- Strengthen anti‑corruption: monitoring betting patterns, education, strict sanctions.
- Heat protocols: evening matches, drinks breaks, heat‑stress monitoring.
- Share / transfer the risk
- Tournament‑wide insurance for cancellation, terrorism, extreme weather.
- Clear contracts with broadcasters/sponsors about rescheduling and force majeure.
- Retain (accept) residual risk
- Accept that a few games may still be lost to weather or logistics despite controls.
- Document what level of residual risk is being accepted, by whom, and with what monitoring.
4. Implementation & Control (Who Owns What, and How Is It Run?)
- Governance & roles
- BCCI Risk Committee: owns the overall risk framework and major decisions.
- Franchise risk owners: handle team‑level logistics, personnel, finances.
- Venue operators: own stadium safety, crowd management, emergency response.
- Communication & consultation
- Regular briefings with teams, broadcasters, police, local authorities.
- Clear public communication on cancellations, rescheduling, and safety decisions.
- Monitoring
- Track near‑misses (e.g. small crushes at gates, close calls with fog or heat).
- Maintain dashboards: incidents per season, delays, injuries, corruption alerts.
5. Review & Continuous Improvement (What Did We Learn This Season?)
After each season / major incident:
- Incident reviews
- IPL suspension: What early warning signs did we miss? Could we have acted sooner?
- Chinnaswamy stampede: Which design and process failures led to casualties?
- Lucknow fog‑out: How should scheduling rules change for fog‑prone venues?
- Mustafizur threats: How do we handle politically sensitive players and venues?
- Effectiveness checks
- Did our treatments reduce likelihood or consequence as expected?
- Did any controls fail or create new risks (e.g. over‑policing crowds)?
- Update the system
- Revise risk criteria, appetite, and tolerances where needed.
- Amend scheduling policies, venue standards, insurance terms, and contracts.
- Feed lessons into next season’s planning: same framework, better parameters.
To-Do List
If Indian cricket embraced systematic risk management, the BCCI would have:
- A Risk Management Policy (BCCI document) establishing appetite and tolerance
- A Risk Register (updated quarterly) tracking all relevant risk categories with assessed severity and treatment strategies
- Incident Response Protocols that trigger automatically (e.g., if weather forecast shows fog, reserve dates activate; if geopolitical tension rises, security protocols engage)
- Venue Certification requiring regular safety audits for all stadiums
- Insurance covering defined scenarios with unambiguous language
- Player Education on corruption risks, mental health impacts of uncertainty, safety protocols
- Stakeholder Transparency (fans, sponsors, broadcasters informed about residual risks and mitigation strategies)
- Continuous Learning (post-incident reviews feeding into policy updates)
Why bother?
Risks are interconnected: geopolitics affects scheduling, which affects logistics, which affects player welfare, which affects performance, which affects revenue. One shock propagates through the entire system.
But the real argument is how all this affects BCCI’s income: In fiscal year 2024-25, the BCCI earned a total of ₹20,686 crore—double what it was five years earlier. But this income doesn’t flow uniformly. It comes from multiple sources, each vulnerable to different risks:
- IPL: ₹5,761 crore (59.1% of FY 2024-25 BCCI revenue)12
- International cricket (men’s): ₹361 crore (3.7%)12
- ICC distributions: ₹1,042 crore (10.7%)12
- WPL (women’s): ₹951 crore broadcast deal over five years = approximately ₹190 crore annually13
- Interest and other income: ₹1,500+ crore from treasury management1214
- Sponsorships, licensing, other: ₹400 crore and growing15
Total bank balance: ₹20,686 crore.16 At this scale, ad-hoc risk management is not neutral—it is negligent.
The numbers are sourced, but even if the numbers are completely wrong, the logic I’m about to present you with will still hold.
Consider the May 2025 IPL suspension. Its immediate impact was ₹1,600-2,000 crore in tournament revenue loss. But the suspension also:
- Forced reschedules of international T20I series planned around IPL slots
- Delayed women’s cricket planning (WPL scheduling coordination)
- Created cascading effects on domestic Ranji Trophy schedules
- Disrupted team preparation windows for the Asia Cup (subsequently postponed)
When the IPL shut down due to the events that followed the Pahalgam terrorism, one risk event rippled across all BCCI’s operations. The ₹3,500-4,000 crore total ecosystem loss wasn’t borne by IPL alone—it distributed across broadcasters, sponsors, franchises, international teams visiting India, and state cricket associations that depend on BCCI’s distributions (approximately ₹100-125 crore in combined sponsorship, broadcast, and match-day revenue for 16 matches15 and the broadcaster JioCinema faced losses of ₹1,900-2,000 crore (35% of their ₹5,500 crore seasonal projection)17 While war is a systemic risk (read more here, scroll down to the risk sections), a stampede at a celebration event is not.
Now let’s do some hypothetical maths. Let’s say of BCCI’s total ₹20,686 crore exposure, 10% is under difficult-to-avoid-risk, and another 20% are things that could go wrong but if everything happened normally (planes flew on time, luggage was not lost, people had common sense, etc.) it would not go wrong. Now assume costs of mitigation to be between 10-20% of the cost of losses. This would be the breakdown of that exposure:
| Risk Category | % of Total Exposure | Exposure Amount (₹ Crore) | Annual Loss Probability | Expected Annual Loss (₹ Crore) | Mitigation Cost (10-20% of loss) | Net Benefit if Mitigated |
|---|---|---|---|---|---|---|
| High Risk (Geopolitical, Corruption, Major Infrastructure) | 10% | ₹2,068.6 | 20-30% | ₹414-620 | ₹41-124 | ₹290-579 |
| Medium Risk (Weather, Logistics, Personnel, Sponsorship) | 20% | ₹4,137.2 | 30-40% | ₹1,241-1,655 | ₹124-331 | ₹910-1,531 |
| Low Risk (Normal operations) | 70% | ₹14,480.2 | 1-5% | ₹145-724 | ₹15-145 | ₹130-709 |
| TOTAL | 100% | ₹20,686 | ~15-20% aggregate | ₹1,800-3,000 | ₹180-600 | ₹1,200-2,820 |
Now let’s do scenario analysis with ILLUSTRATIVE NUMBERS.
Scenario A – No Mitigation (Do Nothing)
| Element | Amount (₹ Crore) | Notes |
|---|---|---|
| Reserves/ Bank Balance | ₹20,686 | Baseline |
| Expected Losses (unmitigated) | ₹1,800-3,000 | From Table 1 |
| Insurance Recovery (40-50% of losses) | ₹720-1,500 | Partial coverage; war/corruption not covered |
| Net Loss After Insurance | ₹1,080-2,280 | Uninsured exposure |
| Effective Revenue After Losses | ₹18,406-19,606 | Revenue minus net loss |
| Annual Cost to Organization | ₹0 | No prevention investment |
| Net Outcome | ₹18,406-19,606 | Revenue minus losses |
Scenario B – Full Mitigation (Invest in Risk Management)
| Element | Amount (₹ Crore) | Notes |
|---|---|---|
| Reserves/ Bank Balance | ₹20,686 | Baseline (unchanged) |
| Mitigation Investment | ₹180-600 | Cost to prevent/reduce losses |
| Expected Losses (with mitigation) | ₹450-900 | Reduced by 60-75% through mitigation |
| Insurance Recovery (40-50%) | ₹180-450 | Still applicable, lower losses |
| Net Loss After Insurance & Mitigation | ₹270-450 | Dramatically reduced |
| Effective Revenue After Mitigation & Losses | ₹20,236-20,416 | Revenue minus mitigation cost and net loss |
| Annual Cost to Organization | ₹180-600 | Mitigation investment |
| Net Outcome | ₹20,236-20,416 | Much better than Scenario A |
None of the above means that BCCI doesn’t do risk mitigation at all. They must do. Matches are insured, security is coordinated with state authorities, schedules are adjusted, and contingency plans exist. But much of this risk management remains reactive, fragmented, and event-specific, rather than systematic.
The scale of Indian cricket has outgrown this approach. What is now a ₹20,000-crore ecosystem operates across volatile geopolitics, increasingly extreme climate conditions, aging infrastructure, fragile logistics, and intense public scrutiny. In such an environment, risk does not arrive as isolated shocks. It propagates. A fog-out affects scheduling, which affects logistics, which affects player welfare, which affects performance, which ultimately affects revenue and credibility. Treating each disruption as an unfortunate exception misses the underlying structure of the problem.
Active risk management does not promise certainty, nor does it eliminate risk. What it offers is clarity: an explicit understanding of working to anticipate risks in our cricket system so that most can simply be prevented, and those that cannot be prevented are mitigated. The IPL did not need to be part of India’s war theatre. After the Pahalgam attacks those matches could have been shifted to lower risk areas, such as away from the border, and we wouldn’t have had Ricky Ponting trying to persuade foreigners to stay back and play.18
Sources
- IPL 2025 Suspended As India-Pakistan Tensions Hit World’s Biggest Cricket League (Forbes)
- Mustafizur Rahman faces threat for playing in IPL 2026, religious leaders in Ujjain warn of disruptions (Firstpost)
- Why has India vs South Africa 4th T20I not started? Excessive fog – reason explained (NDTV Sports)
- RCB IPL victory parade stampede: death toll, live updates from Chinnaswamy Stadium (The Hindu)
- Will shop insurance provide coverage in case of loss or damage caused due to riots? (PolicyBazaar)
- India gambling with cricket’s soul? The spot-fixing scandal explained (BBC)
- Betting, Match Fixing and Online Gambling in India: A Study with Special Reference to Cricket (ResearchGate)
- Gambling and Betting Market in India (Digital India Foundation PDF)
- BCCI reworking IPL 2024 schedule for remainder of season to avoid clashes with polling dates (News18)
- ISO 31073:2022 – Risk management — Vocabulary (ISO 31073:2022)
- ISO 31000:2018 – Risk management — Guidelines (ISO 31000:2018)
- BCCI’s total income shoots up to ₹9,741.71 crore in FY24; IPL alone contributes ₹5,761 crore (Economic Times)
- Viacom18 bags WIPL media rights for Rs 951 crore (Economic Times)
- BCCI gets richer, bank balance jumps to eye-popping Rs 20,686 crore in FY 2024 (News18)
- IPL 2025 suspension due to Ind-Pak conflict cost BCCI nearly INR 125 crore per game (CricTracker)
- IPL’s time-out could lead to a 35% ad revenue wipeout (Financial Express)
- Ricky Ponting persuades Punjab Kings players to stay in India after ceasefire with Pakistan (Mint)