In 2020, Rio Tinto legally blew up 46,000‑year‑old Aboriginal rock shelters at Juukan Gorge in Western Australia to expand an iron‑ore mine.1 The caves contained evidence of continuous human occupation over tens of thousands of years and were sacred to the Puutu Kunti Kurrama and Pinikura (PKKP) people.2
The blasting was technically lawful under existing approvals,3 but it triggered widespread outrage, a parliamentary inquiry,4 and the resignation of the CEO and two senior executives.5 Investors and ESG analysts had already flagged Rio Tinto as weak on community relations and governance factors capturing “risk of operational disruption due to community opposition”.6
It seems obvious that blasting someone’s spiritual sites to pieces would be considered harmful, so why wasn’t Rio able to see this before they did it?
The short answer is: their risk system did not treat those caves as a business risk. They thought it would be enough to simply get governmental approval rather than understanding the historical and cultural value of the caves. The environmental and social damage did not register as a real problem until after it detonated into a governance crisis.
Traditional finance textbooks worry about market and credit risk, the volatility of asset prices, and company‑specific risk that diversified investors can wash away. ESG risk simply asks a different set of questions about the same business:
How fragile is your position if one whistle‑blower email exposes years of “creative” emissions accounting?
What happens when your coal plant becomes uninsurable or unprofitable long before the end of its physical life?
What is your downside if a supplier’s factory fire kills workers and your brand name is on the label?
Those are not “extra” concerns. They are channels through which financial, legal, operational and reputational damage hits a company.
So,
E: “Climate change” becomes a three‑day flood that shuts your main warehouse, a mandatory carbon price that doubles operating costs, or the loss of export markets because you fail EU value‑chain rules.
S: “Labour conditions” becomes a factory fire, a strike during peak season, or a viral video of an abusive supervisor.
G: “Governance” becomes fraud in a subsidiary, a bribery case under anti‑corruption law, or your board signing off on misleading ESG claims and facing regulators later.
Case 1: Ali Enterprises In 2012, a fire at the Ali Enterprises garment factory in Karachi killed more than 250 workers and injured many more, making it one of the deadliest factory fires in modern garment production and Pakistan’s worst industrial accident.7 The blaze reportedly followed an explosion, but what turned it into a mass‑casualty event were basic safety failures: locked exits, barred windows, no functioning fire alarm, inadequate equipment, and workers with no emergency training.7
Weeks before the fire, Italian auditor RINA had certified the factory as compliant with the SA8000 social responsibility standard, on behalf of German discount retailer KiK.8 The audit put a stamp of “safe” on what campaigners later called a death trap.
In ESG terms:
Social: labour rights and health and safety were not marginal; they determined whether hundreds of workers lived or died.
Governance: both the factory’s internal controls and the external certification regime failed. Social audits functioned more as reputational shields for brands than as real safety controls.
For brands sourcing from similar factories, the risk event is not “labour standards in xyz country”; it is “mass‑casualty factory disaster linked to our supply chain”, with consequences including legal claims, disrupted production, and global coverage featuring your logo.
Case 2: Rana Plaza Months later, the Rana Plaza building collapse in Bangladesh killed more than 1,100 garment workers and injured thousands.9 Like Ali Enterprises, it exposed structural failings: illegal construction, ignored warning cracks, and workers pushed back into the building under threat of lost wages.910
Together, Ali Enterprises and Rana Plaza turned factory safety from a “CSR” talking point into a core ESG risk for global fashion brands. They were now forced to answer the question: what is the probability and impact of catastrophic supplier accidents affecting our brand value?11
In response:
More than 200 brands signed the legally binding Bangladesh Accord, committing to fund and enforce independent safety inspections and improvements in supplier factories.12
The Accord’s inspections and remediation programmes significantly reduced safety risks in covered factories, although broader labour standards and the situation in other countries still lagged.13
Again, this is ESG as business risk:
Social: worker safety and freedom to refuse unsafe work.
Governance: the difference between voluntary codes of conduct and binding, enforceable agreements with unions and NGOs.
Case 3:Prologis14 Prologis, a global logistics real estate company, analysed energy consumption across its portfolio, identified inefficiencies, invested in energy‑efficient technologies and renewables, and built this into its tenant proposition. The results included:
Lower energy costs across the portfolio.
A reduced carbon footprint.
Stronger positioning with ESG‑conscious tenants looking for efficient, low‑carbon facilities.
Here:
Environmental risk is transition risk: rising carbon prices, stricter building codes, and tenant demand for green buildings that could otherwise turn older assets into stranded ones.
Social shows up in tenant relationships and expectations.
Prologis treated these as business hazards, not future CSR talking points. It used ESG data to find where margins would quietly erode over time and acted early.
And what about Rio Tinto and the sacred caves? Through an ESG lens:
Environmental: irreversible destruction of a unique cultural and natural heritage site.
Social: Indigenous rights and loss of trust with local communities.
Governance: failure of board and management to treat community opposition and cultural heritage as material risks, not tick‑box compliance.
The risk event here is not “cultural heritage”. It is “destruction of a sacred site leading to loss of social licence, political and investor backlash, and leadership crisis”. The fact that approvals were in place did not prevent reputational loss or the internal disruption of a forced leadership change.
Once you see these stories together, the claim “ESG risk is business risk” stops being a slogan:
Ali Enterprises and Rana Plaza show social and governance failures turning into catastrophic operational, legal, and reputational losses.
Prologis shows environmental and social foresight translating into lower costs and stronger market position.
Juukan Gorge shows an environmental and social misjudgement leading to a governance crisis and loss of social licence.
That is why ESG‑related risks should sit inside the same enterprise risk management framework as credit, operational, and market risks, not in a separate CSR annex. Assess climate, environmental, social, and governance risks on the same likelihood and impact scales you use elsewhere, so boards can compare them directly and prioritise consistently.
Proactive ESG risk management then looks like any good risk practice:
Watching for weak signals and early warning indicators (accidents in similar factories, community complaints, climate policy shifts).
Stress‑testing strategies against multiple futures, including more aggressive climate policy or stricter human‑rights regulation.
Updating assumptions as technology, regulation, and stakeholder expectations move.
ESG does not create new categories of risk. It forces companies to confront risks they were already running but not properly measuring. Ultimately, value is shaped as much by social licence, institutional trust and regulatory trajectory as by commodity prices or quarterly earnings, and companies that treat ESG signals as peripheral optics problems discover too late that they were early warnings of business loss. Those that integrate them into core decision-making, capital allocation and board oversight are not being “ethical” in a narrow sense; they are protecting asset value, preserving optionality, and reducing the probability of reputational damage.
In 2013, while conducting research for my Master’s thesis, I met corporate leaders who did not understand why climate change was something businesses were being held responsible for. They were often quite resentful, and yet, nearly all of their organisations had suffered from the Mumbai floods that happened that year- for one of them, a logistics company, the losses were so heavy they planned to shift their warehouses out of the city.
Climate change was viewed as a political issue, even as it was already disrupting operations. However, climate risk is no longer about ethics or disclosure; it is about competitive survival.
A viral picture of the Goldman Sachs building that remained powered and largely unscathed despite being in a mandatory evacuation zone during Hurricane Sandy in 2012.1
The point is not abstract. During Hurricane Sandy in 2012, a widely shared image showed the Goldman Sachs building in lower Manhattan lit and operational while much of the surrounding area was dark. The firm had invested heavily in resilience infrastructure. Business continuity became a competitive advantage.
In a 2015 speech,2 Mark Carney, then Governor of the Bank of England, argued that climate change is a “tragedy of the horizon” because its worst effects will be felt beyond the traditional horizons of business planning, political cycles, monetary policy, and financial regulation. Current decision‑makers therefore have weak incentives to act even though future generations will bear the costs, creating a structural mismatch between where the risks sit and where the power to respond lies.
He highlighted three channels through which climate change threatens financial stability:2
Physical risks: losses from more frequent and severe floods, storms, heatwaves, and other weather‑related disasters.
Liability risks: lawsuits and compensation claims against firms and directors for contributing to or failing to manage climate harms.
Transition risks: repricing of assets as policy, technology, and consumer preferences shift toward a low‑carbon economy, creating “stranded assets,” especially in fossil fuels.
Because standard risk models and planning cycles rarely look out beyond a decade, they miss non‑linear climate shocks and underestimate the scale of structural change required, especially under scenarios that keep warming well below 2°C.34
Climate change is no longer a CSR issue; it is a core strategic, financial, and operational risk56 affecting supply chains, asset location decisions, insurance costs, regulatory exposure, consumer demand, and access to capital.
Breaking the tragedy of the horizon requires extending risk management beyond conventional timeframes and embedding climate risk into today’s decision systems. We are already experiencing climate risk, and there is no way to fully insulate every asset from its effects.
For financial institutions, climate risk shows up as credit risk (borrowers’ ability to repay), market risk (asset price changes), operational risk (disruptions to operations), and reputational risk (backlash over financing high‑emitting activities). Empirical work on banks shows that exposures to transition risk are currently modest in portfolio terms but concentrated in specific sectors, and that banks signing net‑zero alliances have begun to reduce lending to the riskiest industries.78
For corporations, the following may help:
Risk identification: Map climate hazards and drivers (heat, floods, drought, storms, sea‑level rise; carbon prices; regulations; technology shifts) to specific assets, operations, and supply chains.
Assessment and quantification: Use tools ranging from high‑level heatmaps to asset‑level hazard models and financial impact assessments (e.g., revenue at risk, cost of goods sold, capex needs).
Integration into Enterprise Risk Management (ERM): Incorporate climate risks into risk registers, materiality assessments, internal controls, and capital budgeting, with clear thresholds for escalation.
For financial institutions, more technical steps include:
Exposure mapping: Quantify portfolio exposure to vulnerable sectors and geographies as a share of lending and investment books.
Climate-adjusted credit analysis: Incorporate emissions intensity, transition plans, and physical risk exposure into underwriting and pricing.
Scenario stress testing: Use Network for Greening the Financial System (NGFS) or equivalent scenarios to assess losses under combinations of policy tightening and physical shocks.
Regulators increasingly expect banks and insurers to demonstrate that climate risks are integrated into their internal capital adequacy assessments, risk appetite statements, and supervisory dialogues.9
For banks and investors, an important nuance is that reducing portfolio emissions too mechanically by divesting from high‑emitting sectors can undermine real‑economy transition, because those same sectors (power, steel, transport) require capital to decarbonise. Leading practice therefore shifts from simple “brown exclusion” to engagement, conditional finance, and transition‑linked instruments.1011
All of this reframes climate change from a distant macro-risk into an immediate business continuity problem. The question is no longer whether climate risk matters, but how organisations operationalise it within decisions made today. Businesses and financial institutions must change how they allocate capital and design products. Climate‑aligned finance involves both reducing exposure to misaligned activities and growing exposure to solutions.12
For non‑financial corporates:
Shift capex toward energy efficiency, low‑carbon technologies, and resilience measures (e.g., relocating assets, flood‑proofing, cooling infrastructure), guided by scenario‑tested business cases.
Integrate internal carbon pricing into investment decisions and product design to reflect transition risk and incentivise low‑carbon choices.
Explore innovative risk‑sharing instruments, such as parametric insurance for climate‑related losses or resilience bonds linked to infrastructure upgrades.
For financial institutions:
Develop green and sustainability‑linked products (green bonds, sustainability‑linked loans, transition bonds) with clear use‑of‑proceeds criteria and performance‑based pricing.
Use portfolio alignment tools (e.g., implied temperature rise metrics, sectoral pathways) to steer lending and investment toward net‑zero‑compatible activities, while monitoring credit risk.
Avoid “paper decarbonisation” that simply sells high‑emitting assets to less regulated owners; instead, engage with clients to finance credible transition plans and set conditions for continued support.
Research shows that, so far, banks’ transitions have been gradual and often focus more on emissions metrics than on real‑economy outcomes, underscoring the need to link commitments to enforceable policies and incentives.
To translate this into an actionable agenda, organisations can focus on a staged approach:
Diagnose and govern: Brief boards on climate risk exposure. Assign clear oversight at board and executive levels.
Measure and disclose: Strengthen scenario analysis, emissions tracking, and exposure metrics. Build data systems aligned with emerging standards.
Integrate into risk and strategy: Embed climate considerations into ERM, capital budgeting, procurement, and sector strategies.
Align capital and incentives: Set science-based targets with interim milestones. Adjust lending and investment policies to phase out clearly misaligned activities while scaling transition and resilience finance.
Engage and collaborate: Work with regulators, alliances, clients, and suppliers to raise standards and avoid a race to the bottom.
Traditional business continuity frameworks assume that shocks are temporary, insurable, and geographically contained. Climate risk increasingly violates all three assumptions. The tragedy of the horizon is therefore not just about time, but about governance. Climate risks accumulate slowly, crystallise suddenly, and cascade across balance sheets, supply chains, and communities. By the time they appear in backward-looking metrics, strategic options have already narrowed.
For corporations and financial institutions alike, the challenge is no longer one of awareness or disclosure. It is whether decision-making systems — capital allocation, product design, credit assessment, and continuity planning — can be rewired to operate under conditions of deep uncertainty and irreversible change. Those that succeed will not eliminate climate risk (that’s impossible). They will internalise it early, adapt faster, and preserve optionality as the transition unfolds. Those that do not may find themselves where many firms were in the early 2010s—surprised by risks that were already visible, and outperformed by competitors who prepared earlier.
A 40-year-old non-smoker in Delhi faces a measurable probability of dying in the next year. If the 40 year old is a woman, she will have a slightly better chance at life than a male counterpart. If she lives in a wealthy area, her chances are once again better than another woman living in a less privileged location.123
How do we know this? We know this because actuaries work with mortality and health data from millions of people, and build tables that segment risk by age, gender, smoking status, income, and even geography, to price policies accurately.4
Types of risk Over time, experts have classified risk into different types. Here’s a table about the different types of risk:
The possibility of loss from natural events or accidents. The oldest, most intuitive kind of risk.
• Unintended—nobody wants them • Objective frequency data—insurers have centuries of records • Insurable—probability and consequence can be estimated from historical data • Cannot create profit—only causes loss
• Fire and property damage • Windstorms and hail • Theft and burglary • Flooding • Liability from personal injury
The risk that your business’s internal machinery breaks down. Unlike hazard risk, it’s inherent to doing business—you can’t eliminate it, only manage it. Also cannot be diversified away. Defined by Basel II as: “Risk of loss from inadequate or failed internal processes, people and systems, or external events.”
• Inherent to operations—impossible to eliminate • Non-diversifiable—all firms in an industry face similar operational risks • Hard to quantify—driven by control quality and governance, which are difficult to measure • Multiple sources—spans people, processes, systems, and external events
Process Failures: Accountant enters data incorrectly, leading to wrong financial statements; Wrong calculation of tax liabilities
Human Error: Surgeon operates on wrong patient; Employee sends confidential email to wrong recipient; Trader executes wrong order
System Failures: Bank’s payment system crashes; Company’s website goes down during peak shopping season; Database corruption losing customer data
Risk from changes in financial variables: credit defaults, price movements, or inability to access funds. Encompasses three subcategories.
• Market-driven—determined by supply and demand in public markets • Observable prices—interest rates, bond spreads, stock prices are public • High correlation—multiple financial risks often move together during crises
Credit Risk: Borrower fails to repay loan; Bank faces default
Market Risk (Interest Rate, Equity, Currency, Commodity): Interest rates rise, bond portfolio value falls; Stock prices decline; Rupee weakens against dollar; Oil prices spike increasing business costs
Liquidity Risk (Asset & Funding): Cannot sell asset when needed (asset liquidity); Cannot raise cash when obligations due (funding liquidity)
Risk that your business strategy is wrong. Risk from strategic decisions and competitive threats that can derail long-term objectives. Highest impact, but low frequency.
• High impact, low frequency—rare but potentially catastrophic • Long-term consequences—effects persist for years • Cross-functional impact—affects entire organization • Forward-looking—requires anticipating future changes • Not quantifiable—each situation is somewhat unique
Poor Strategy Decisions: Entering unviable new markets; Expanding too quickly into new industries; Pricing strategy that’s unprofitable
Competitive Threats: New disruptive competitor; Competitor’s aggressive pricing; Merger of competitors
Technological Disruption: Emerging technology makes business model obsolete (e.g., ride-sharing disrupting taxis); Failed innovation or delayed product launches
Resource Misalignment: Allocating resources to declining products instead of growth opportunities
Market/Industry Changes: Shift in customer needs and expectations; Regulatory changes forcing business model changes
The risk that you violate laws, regulations, or internal policies, resulting in fines, legal action, or reputational damage. The regulatory environment is constantly changing.
• Pervasive—affects all areas of organization • Constantly evolving—new regulations, changing requirements • Penalties escalating—fines and enforcement becoming more severe • Jurisdiction-dependent—different rules in different countries • Partly controllable—you can strengthen controls, but regulatory changes are external
Financial Crimes: Money laundering violations; Bribery and corruption; Sanctions violations
Data & Privacy: GDPR violations (Europe); CCPA violations (California); HIPAA violations (healthcare); Customer data breaches
The risk that negative publicity damages your brand, eroding customer trust, investor confidence, investor perception, or ability to attract talent. One of the hardest risks to quantify.
• Hidden until it happens—not visible in normal operations • Disproportionate impact—market values reputation more than the direct financial loss • Self-inflicted worse than external—fraud damages reputation 2x more than accidents • Long recovery time—trust takes years to rebuild • Interconnected—affects customer base, employees, investors, partners simultaneously
Product/Service Failures: Volkswagen emissions scandal (2015): $30B+ in losses, brand destroyed, took years to recover; Boeing 737 MAX crashes: customer confidence shattered; Product recalls damaging trust
Ethical/Fraud Issues: Wells Fargo account scandal: reputation destroyed despite being largest bank; Facebook/Meta privacy scandals: customer trust eroded
The risk of losses from disruption or failure of IT systems, data breaches, ransomware attacks, or technology obsolescence. Increasingly distinct from general operational risk.
• Rapidly evolving threat landscape—new attack vectors constantly emerge • Control-dependent—pricing based on current security posture, not history • Insurance available—unlike most strategic risks, cyber can be insured • Industry-dependent—high-risk sectors (finance, healthcare) pay more • Improving controls reduce premiums—strong incentive alignment
Data Breaches: Hackers steal customer information; Personal data of millions exposed; Regulatory fines and lawsuits follow
Ransomware Attacks: Criminals lock you out of systems; Demand payment to restore access; Business operations halt
System Failures: Software bugs or aging infrastructure cause crashes; Website goes down; Payment systems fail
DDoS Attacks: Website flooded with traffic, becomes inaccessible; Business loses revenue during attack
The possibility of loss from natural events or accidents. The oldest, most intuitive kind of risk.
Relatively straightforward to price because: Historical data is abundant and reliable Frequency and severity are stable over time
Easiest to price. Insurers have vast datasets spanning centuries showing how often fires, floods, and accidents occur. This precision makes hazard risk the most competitively priced and cheapest form of risk insurance.
The risk that your business’s internal machinery breaks down. Unlike hazard risk, it’s inherent to doing business—you can’t eliminate it, only manage it. Also cannot be diversified away. Defined by Basel II as: “Risk of loss from inadequate or failed internal processes, people and systems, or external events.”
• Real drivers (control quality, governance, employee skill) are hard to measure • Cannot use simple historical formulas • Basel II uses crude proxy: operational risk capital = percentage of gross income • Limited historical data compared to hazard risk • Outcomes are correlated across firms during crises
Cannot diversify away. When 100 banks all face the same operational risk (say, a payment system cyberattack), they all suffer simultaneously. This systemic nature makes operational risk expensive to accept and pricing it requires judgment, not just formulas.
Risk from changes in financial variables: credit defaults, price movements, or inability to access funds. Encompasses three subcategories.
• Models based on historical data miss tail risk (rare catastrophic events) • Correlation assumptions break during crises (2008 showed this) • Pricing assumes future resembles past • Volatile and difficult to predict
Impossible to price accurately at extremes. Financial risk is driven by market sentiment, which can shift suddenly. Models work 99% of the time but fail catastrophically in the 1% (like 2008), when many risks materialize simultaneously.
Risk that your business strategy is wrong. Risk from strategic decisions and competitive threats that can derail long-term objectives. Highest impact, but low frequency.
• No historical data for “probability that our strategy fails” • Each strategic decision is somewhat unique • Cannot use formulas or actuarial tables • Outcomes depend on management judgment and execution • Extremely difficult to quantify in advance
Cannot be insured. Strategic risk is almost entirely uninsurable because each company’s strategy is unique. CEOs and boards must accept this risk as part of doing business. Pricing relies on scenario analysis and management judgment, not hard data.
The risk that you violate laws, regulations, or internal policies, resulting in fines, legal action, or reputational damage. The regulatory environment is constantly changing.
• Probability of enforcement depends on regulator priorities (which change) • Penalties are often discretionary and unpredictable • New regulations create retroactive compliance challenges • Conflicting guidance from different regulators • Costs increase with regulatory tightening
Costs are rising fast. Regulators are increasingly aggressive, penalties are larger, and reputational consequences are severe. Organizations must continuously invest in compliance infrastructure (legal teams, compliance officers, audits) as a cost of doing business.
The risk that negative publicity damages your brand, eroding customer trust, investor confidence, investor perception, or ability to attract talent. One of the hardest risks to quantify.
• Stock price falls MORE than announced loss (2x for fraud, 1x for accidents) • 26% of company value is directly attributable to reputation (one study) • No standard pricing model • Very difficult to quantify until it happens • Historical data limited
Stock market values reputation more than we can measure. When a company announces a $1B fraud loss, stock price might fall 5% ($5B loss in value). The extra $4B is “reputational loss”—the market’s judgment that the company is now riskier. Yet most companies can’t quantify or insure this risk.
The risk of losses from disruption or failure of IT systems, data breaches, ransomware attacks, or technology obsolescence. Increasingly distinct from general operational risk.
• Unlike hazard risk (stable data over decades), cyber threats evolve rapidly • Historical data is unreliable—new attack types didn’t exist 5 years ago • Pricing focuses on current security posture not past incidents • Rapidly changing insurance market (premiums spiked 80% in 2021-2022) • Standardization emerging (ISO 27001, NIST)
Pricing is behavior-based. Unlike traditional insurance (fixed premium regardless of actions), cyber insurance prices based on your current controls. Companies with firewalls, multi-factor authentication, and ISO 27001 certification pay ₹80,000/year. Those with weak security might pay ₹3,00,000 or be denied coverage. This creates powerful incentives to improve security.
Therefore, risk can technically be transferred from one person to another. And this can be offered as a business service, for a price.
Now, before we go into this further, please understand that some risks can never be transferred- just that the effect of their impact can be mitigated. People will die, that is life. But by buying term insurance, we can ensure our families don’t suffer financial loss as well as the loss of our love and support. Similarly, living beings get sick- by purchasing health insurance we can just make sure we don’t face financial difficulties if we ourselves get sick in a way that costs a lot of money to fix. We are not transferring the death and decay, we are transferring the financial cost of these events.
1. The Formula2021 With that out of the way, when someone asks you to bear their risk, you charge them a price. That price is made up of several components:
Price of Risk = Expected Loss + Administrative Costs + Risk Loading + Profit Margin
Where:
Expected Loss is simply: Probability × Consequence. If there’s a 2% chance of a ₹100,000 loss, the expected loss is ₹2,000.
Administrative Costs are the cost of doing business. For an insurer, this includes underwriting (reviewing your application), policy servicing (managing your account), claims processing, and marketing. For a bank, it includes loan documentation, monitoring your creditworthiness, and collecting payments if you default.
Risk Loading is the “insurance premium on the insurance premium.” It’s an extra charge you demand to accept the fact that reality might differ from your expectations. This is where variance becomes critical.22
Profit Margin is what you keep as profit.
2. Variance
Variance is uncertainty about whether actual outcomes will match expected outcomes. As risk increases, variance often increases faster. Why? This happens because most people will fall closer to the middle of the normal distribution (discussed in the post linked at the beginning of the paragraph), but as risk increases, the number of people who are either that risky or are willing to take that risk are fewer and fewer (few will skydive, more will bungee jump, most will fly commercial). The fewer the number of people to whom a risk applies, greater the chances of variance (because the insurer has fewer people over whom to spread the risk). In other words, the law of large numbers works less effectively with small groups. With 1 million people, outcomes average out predictably, so let’s say you get the same or very similar number of claims every year. With 50 people, you might get zero claims one year and three claims the next—massive volatility.
I just want to be sure this is clear, so here is another example. Suppose two people pool their money every month, and decide that if one of them gets sick, the sick person can to use a certain percentage of the total money pooled (collected) by both of them to pay for the treatment. It is possible that for many years no one gets sick, but it is also possible that one (50%) of the total contributors or both (100% of the total contributors) get sick one day. On the other hand, in a pooled health insurance which has many contributors, say 1 million contributors, if 1 person gets sick, they are 1/1,000,000 of the total number of contributors (or 0.0001% of the pool- much, much less than 50%, right?).
Secondly, higher-risk individuals have more uncertain outcomes—meaning it’s harder to predict exactly what will happen. A skydiver faces multiple possible outcomes with varying probabilities: they could live unharmed, break bones, die from equipment failure, die from a heart attack mid-jump, or face other unpredictable complications. Each outcome has a different probability, making the overall risk calculation more complex. In contrast, a person simply walking on the ground faces far fewer potential causes of serious injury or death, so the range of possible outcomes (variance) is much narrower. Another way of looking at this is that a 30 year old healthy non smoker likely has fewer known causes of death historically than a 70 year old smoker.
This is why insurance premiums for risky people increase disproportionately:
The insurer must hold more capital to protect against bad luck.
A 30-year-old non-smoker with a 0.05% probability of death in a year might have a premium of ₹3,000.
A 60-year-old smoker with a 1% probability of death (20x higher) doesn’t pay 20x the premium (₹60,000). They pay 50x+ the premium (₹1,50,000 or more) because:
The absolute expected loss is 20x higher.
The variance around that expected loss is also much higher (more uncertainty about outcomes).
Insurers also worry about correlation—the risk that many claims happen simultaneously. A life insurer pricing individual deaths assumes they’re independent. But if a pandemic strikes, many policyholders might die at once. This correlation risk requires extra capital, adding to the risk loading.2324
Uncertainty When an insurer lacks information about a particular risk, they will charge more for it, because they do not know how potent the risk is, or how frequently it occurs.2526
Suppose a bank is deciding whether to lend to two borrowers, both with self-reported income of ₹10 lakhs per year.
Borrower A: A salaried employee with 10 years of bank statements, tax returns, and employer verification. The bank has rich information about their actual, consistent income.
Borrower B: A self-employed consultant with only 2 years of tax returns. Income has varied between ₹5 lakhs and ₹15 lakhs per year. The bank’s uncertainty about their true ability to repay is high.
Both might have estimated default probabilities of, say, 2% based on available data. But the bank will charge Borrower B a higher interest rate, not because their actual default probability is higher, but because the bank’s uncertainty about that probability is higher.
This principle explains all of the following:
Businesses in developed countries with strong financial reporting get cheaper capital than those in developing countries with weak disclosure.2728
Companies listed on stock exchanges get better rates than private companies (more transparency).29
Established firms in regulated industries get better rates than startups in emerging sectors.30
Therefore, the more standardised and measurable a risk, the cheaper it is to price and the lower the price demanded. Insurance for hazard risk (with centuries of actuarial data) is cheaper relative to coverage than climate insurance (with only decades of data).31 VaR models for market risk are widely accepted because market prices are observable. But there’s no standard model for reputational risk, so it’s not widely insured.32
This creates a system where:
Predictable, measurable, insurable risks get priced accurately and competitively.
Unpredictable, hard-to-measure risks are either:
Not insured at all (like most strategic risk).
Priced with huge margins because of the uncertainty (like reputational risk).
This is a profound source of inefficiency in capital allocation. Risks that are easiest to measure and quantify get the cheapest pricing and most capital. Risks that are hardest to measure—sometimes the ones that matter most—get starved of capital or don’t get priced at all.
A problem that has emerged from this is that historical models can simply not price tail risks (risks at the corners of normal distributions). An area this affects is climate risk, and its pricing.3334 A different example many of us lived through was the 2008-09 subprime financial crisis. In 2008, banks had calculated that simultaneous mortgage defaults across their portfolio should happen once every few thousand years. Yet it happened in 2007-2008. Why?35
The models went with historical data and assumed:
Housing prices wouldn’t decline nationwide (they always went up historically).36
Unemployment wouldn’t spike across industries simultaneously.37
But all three happened together, creating a “perfect storm” that the models had assigned nearly zero probability. The tail risk was real; the pricing was wrong. Financial institutions now conduct stress testing—asking, “What if housing prices fell 30%? What if unemployment doubled? What if credit markets froze?“—precisely because historical models miss these scenarios.
Thus, if a financial advisor saying “stocks haven’t crashed in 50 years, so the probability is very low” is engaging in tail risk underpricing, and yet, we do still use the method to price some kinds of risk. The next section talks about this and other methods of risk pricing.
Pricing different risks
Methodology 1: The Actuarial Approach (Hazard Risk)4 Insurance companies maintain vast databases of historical claims. For life insurance, they track millions of deaths by age, gender, health status, and lifestyle. For home insurance, they track fire and weather damage claims by location and property type. For auto insurance, they track accidents by driver age, vehicle type, and location. From this data, actuaries calculate frequency (how often does the event occur?) and severity (how much damage when it does?). The math relies on:
Having huge sample sizes (law of large numbers).
Accurate historical data (actuarial tables updated constantly).
Stable risk—the probability of death doesn’t change dramatically over time.
Why this works: Hazard risk has all these properties. Insurers have massive datasets, deaths are well-documented, and the probability of death doesn’t swing wildly year to year.
Why it fails: When underlying assumptions break, actuarial models fail. During COVID-19, mortality rates spiked unexpectedly, and life insurers faced massive losses. The historical tables became temporarily unreliable.
Methodology 2: The Credit Approach (Financial Risk)383940 Banks estimate the Probability of Default (PD) of a borrower. This comes from:
Credit ratings (developed from historical default rates of companies with similar characteristics).
Loan characteristics (collateral, loan-to-value ratio, term length).
They also estimate Loss Given Default (LGD)—how much money the bank recovers if the borrower defaults. If a borrower defaults on a ₹100 lakh loan backed by ₹60 lakhs of collateral, the LGD is 40%.
The interest rate spread (the premium above the risk-free rate) is then set approximately as:
Compensation for the risk that a government blocks or restricts cross-border payments, even if the borrower wants to pay
Different types of risk premiums that may be charged by banks on loans
Why this works: Credit markets are large and competitive. Banks have decades of default data. Collateral can be valued. PD and LGD can be estimated with reasonable accuracy.
Why it fails: When credit conditions change suddenly (as in 2008), the relationship between PD and actual defaults breaks. A borrower who seemed safe (PD 1%) might suddenly have a 20% probability of default if the economy collapses. This is called “correlation risk”—risks that seemed independent are actually correlated, and they all materialize simultaneously.
Suppose you hold a portfolio of Indian stocks worth ₹1 crore. You want to know your VaR at 95% confidence for one day.
Here’s how you calculate it:
Gather historical data: Look at how much your portfolio’s value changed each day over the past 5 years (roughly 1,250 trading days).
Calculate daily returns: On some days, your portfolio gained 2%. On others, it lost 3%. Most days, changes were small (±0.5%).
Rank all the losses: Sort all the daily changes from worst to best.
Worst day: -10% (₹10 lakh loss)
95% of days: losses were less than -7%
Typical days: ±1%
Identify the 95th percentile: Find the loss that was exceeded on only 5% of days (the worst 5% of outcomes). Let’s say this was -7%.
Your VaR is ₹7 lakhs.
What this means in plain English: “Based on historical patterns, we are 95% confident that on any given day, we won’t lose more than ₹7 lakhs. But on 1 out of every 20 days (5% of the time), we might lose more than this—possibly much more.”
How Banks Use VaR:
Banks use VaR for three main purposes:
Setting risk limits: “No trader can hold a position with VaR greater than ₹50 lakhs.”
Allocating capital: “This trading desk’s portfolio has VaR of ₹2 crore, so we must set aside ₹2 crore in capital to cover potential losses.”
Pricing risk: “We need to earn at least 10% return on our ₹2 crore capital (₹20 lakhs per year), so the portfolio must generate returns higher than the risk-free rate by at least this amount.”
Why this works: Market prices are observable and historical data is abundant. VaR is simple to calculate and widely understood.
Why it fails spectacularly: VaR assumes the future resembles the past. When it doesn’t—when a “tail risk” event occurs that’s much worse than historical data suggested—VaR provides false confidence. Black swan events—outliers far beyond historical norms—happen more often in real markets than VaR predicts. This is why sophisticated risk managers now conduct stress tests: “What if housing fell 30%? What if correlation across assets went to 1.0 (everything moves together)?” These scenarios often have probabilities that can’t be estimated from historical data.
Methodology 4: Reputational Risk Quantification16175556 Reputational risk is one of the hardest to price because reputation damage is:
Yet we know reputation has enormous value because research shows that roughly 26% of a company’s market value is directly attributable to its reputation.57 So how do we price something intangible?
The Stock Price Method: When a company announces a major negative event (fraud, scandal, product failure), the stock price falls. But often, the stock price falls more than the announced financial loss. The difference is the market’s estimate of reputational damage.
Reputation Risk Quantification Models that try to systematically price reputation risk:
Identify reputation threats: Product recalls, scandals, poor earnings, social media backlash
Estimate frequency: How often does each type of event happen in this industry?
Model financial impact: Customer loss, revenue decline, employee turnover costs
Quantify total effect: Project impact on profits over 3-5 years
However, unlike life insurance (centuries of death data) or credit risk (decades of default data), reputation damage is:
Context-dependent: The same scandal might destroy one company but barely hurt another
Hard to predict: Social media can amplify or diminish reputational harm unpredictably
Self-reinforcing: Initial reputation damage can trigger customer flight, making things worse
This is why most companies don’t buy reputation risk insurance:
Insurers can’t agree on how to price it
Coverage is extremely expensive when available
Policies have many exclusions
So reputation risk remains largely self-insured—companies must manage it through strong governance, ethical culture, and crisis response planning, but they can’t transfer it to an insurer the way they can with fire risk or credit risk.
Methodology 5: The Security Audit Approach (Cyber Risk)585960 Historically treated as operational risk, cyber risk is now often priced separately. Unlike traditional hazard risk (based on decades of historical data), cyber insurance prices risk based on current security posture. Insurers conduct security audits assessing:
Business context: Industry (finance = higher risk), revenue size, number of employees, data sensitivity.
Unlike traditional insurance (where you pay a fixed premium regardless of your actions), cyber insurance creates incentive alignment. Companies are rewarded for improving security. This is why cyber premiums vary so widely—from ₹80,000 to ₹3,00,000 for similar coverage, depending on security posture, so if the insured company becomes better prepared, its insurance premium can go down. The industry is evolving rapidly. As cyber threats evolve, pricing models are updated. Premiums spiked 80% in 2021-2022 (due to ransomware explosion) but have stabilized as companies improved controls and insurers refined models.
Methodology 6: Scenario Analysis (Strategic Risk)6162 Strategic risk is fundamentally different because:
Can’t be insured—no insurer will cover “your strategy might be wrong”
No historical data exists for “probability our specific strategy fails”
Each decision is unique—your market entry isn’t comparable to another company’s
Outcomes depend on management judgment, execution capability, and competitor actions
Instead of formulas, companies use scenario analysis—imagining multiple possible futures and testing strategy robustness across them.
The Process:
Step 1: Define the Current Strategy: Example: An e-commerce company currently selling books and electronics is considering expanding into furniture delivery.
Step 2: Imagine Alternative Futures (Scenarios): Scenario planning typically develops 3-5 scenarios representing different ways the future might unfold. Assign probabilities to different scenarios and how much loss your company would bear, for example, a company may have a scenario that
Step 3: Calculate Expected Value (With Huge Caveats).
Example:
Scenario A: “Competitive Onslaught”
3 major competitors enter within 18 months
Price war erupts, margins drop 20%
Company loses ₹50 crore over 3 years
Probability: 60%
Scenario B: “Logistics Nightmare”
Delivery complexity exceeds expectations
High return rates (15%)
Company loses ₹30 crore
Probability: 40%
Scenario C: “Weak Demand”
Market adoption slower than projected
Company loses ₹80 crore
Probability: 30%
Scenario D: “Success”
Market responds positively
Company gains ₹150 crore
Probability: 20%
Note: Probabilities don’t need to sum to 100% because scenarios aren’t mutually exclusive—multiple scenarios could occur simultaneously (e.g., you could face both competitive pressure AND logistics challenges).
Expected Outcome = (Probability of Scenario × Impact)
Why this works: Strategic risk isn’t insurable. There’s no historical data on “furniture market entry outcomes” for this specific company. Each strategic decision is somewhat unique. Organizations can’t buy insurance for strategic risk; they must manage it through planning, contingency analysis, and management judgment.
Why it fails: Scenarios often miss the most important surprises. In 2020, COVID-19 wasn’t in most companies’ scenarios. When reality diverges from scenarios, organizations must adapt on the fly. This is why CEOs, not risk managers, bear ultimate responsibility for strategic risk.
TL;DR, because this is not a post for cricket casuals:
Fog in North India in December, heat waves in April, election clashes, and security disruptions are predictable risks, not bad luck.
Indian cricket continues to treat these as isolated incidents rather than as interconnected system-level risks that cascade across scheduling, logistics, player welfare, and revenue.
The BCCI now runs a ₹20,000-crore ecosystem, yet lacks a transparent, enterprise-wide risk management framework appropriate to that scale.
Global sports bodies manage similar uncertainties using formal risk frameworks (e.g., ISO 31000) to decide what risks to avoid, mitigate, insure, or accept.
Applying ISO 31000 to Indian cricket shows that systematic risk management would cost far less than repeated disruptions, cancellations, and credibility damage.
At this scale, ad-hoc risk management is not neutral—it is value-destructive.
And now onto the post.
This post has been inspired by watching the BCCI schedule summer matches in tropical South India, and winter season matches in our smoggy chilled North. Watching Indian cricketers roam about in Lucknow against South Africa while wearing pollution masks while broadcasters told us match was delayed due to low visibility conditions made me wonder what other risks BCCI could just avoid, or at least manage better.
These risks are predictable. FogSmog in North India in December isn’t a surprise. Heat waves in April aren’t black swans. Even geopolitical and security disruptions, while unpredictable, follow recognisable patterns. Yet Indian cricket continues to treat these as isolated “incidents” rather than as interconnected risks that can be anticipated, priced, and managed.
This is not about fog or heat. It’s about running a ₹20,000-crore system without an enterprise risk framework. So I’m doing an ISO 31000 evaluation for the BCCI. FOR FREE. Please someone share this with anyone influential in the BCCI.
Here’s a non-comprehensive list of some risk sources and events that can happen. You can skim through it if you like, I know it’s long, which already tells you lots:
Risk Category
Specific Risk
Example/Evidence
Risk Source
Impact Area
Geopolitical & Security
Cross-border conflict/military escalation
IPL 2025 suspension due to India-Pakistan tensions (May 2025)1
Political/regulatory external context
Tournament suspension, revenue loss, player safety concerns
Geopolitical & Security
Communal/religious tensions
Mustafizur Rahman threats from Ujjain religious leaders (Dec 2025);2
Social/political external context
Player threats, stadium disruptions, player unavailability
Negative sentiment from cancellations, perceived mismanagement
Communications/perception risk
Brand damage, sponsor pressure, fan retention loss
Health & Safety
Pandemic-related restrictions
COVID-like scenarios requiring lockdowns or capacity restrictions
Health emergency/external event
Match cancellation, venue capacity limits, player quarantine requirements
Health & Safety
Food/water safety incidents
Contaminated food/water affecting teams or spectators
Health/hygiene risk
Illness outbreaks, regulatory action, liability
Health & Safety
Air quality/pollution issues
High pollution affecting visibility, player respiratory health
Environmental hazard
Match visibility issues, player health concerns, match cancellation
Before diving into solutions, let’s define what we’re actually talking about. ISO 3107310 establishes the vocabulary for various terms used in ISO 31000,11 which is the ISO framework for risk management. According to the frameworks, risk is “the effect of uncertainty on objectives”. Here,
Objectives are whatever results the organisation wishes to achieve.
Effect means a deviation from the expected, whether the deviation is positive, negative, or both;
Uncertainty occurs from a deficit of information; and
Therefore, risk is a deviation from the aims that an entity is working towards caused due to lack of knowledge about the situations surrounding the objective. The deviation can have a positive or negative outcome, but the deviation means it is still a risk, and leads to risk consequences, or outcomes that affect the objectives.
Uncertainty can never be removed entirely. As we see in the normal distribution, risk events can happen even when we are 99.999% certain of our processes. This is called residual risk, or when a risk event occurs even when controls have been applied against the risk source. An event is the occurrence or change of circumstances (the bridge collapses, prices spike, new regulations take effect that can be the source of a risk. A risk source is an element with potential to give rise to risk (think: aging infrastructure, volatile commodity prices, regulatory change). Understanding residual risk is critical for determining whether further treatment is needed or whether the organisation should accept and monitor what remains. It is important to emphasise here that everyone perceives risk differently (risk perception): engineers might see technical risks as manageable; the public might see the same risks as terrifying. Effective risk communication requires understanding these perceptual differences.
The likelihood of an event, is a broad expression of the chance of something happening, and can be expressed qualitatively or quantitatively, but in the previous posts we have understood what a probability is, as expressed between 0 and 1 (here and here), and frequency, which is when we count the number of the type of events we are quantifying. understanding these basic terms helps us understand how vulnerable we are due to our exposure to a source of risk, as well as how to build resilience. Because we’re discussing a standard, these words have specific definitions:
Vulnerability refers to intrinsic properties creating susceptibility to risk sources.
Exposure measures the extent to which an organization is subject to an event.
Resilience captures adaptive capacity in complex, changing environments, so this isn’t about preventing events, it’s about how to recover from them.
Understanding risk also helps organisations understand which risks to accept, and which to defend against. New Zealand’s sports sector adopted ISO 31000 in 2016; Australia’s sporting associations follow it; international sporting events apply it to pandemic preparedness. This is called Risk attitude- the organisation’s overall approach towards risk, and their tendency to pursue, avoid, or accept it. Attitudes towards risk always depend upon any entity’s risk appetite (the amount and type of risk they are willing to accept), and their risk tolerance, which looks at specific risks for each objective. An example of risk appetite is the willingness to invest in innovative technology, and that of risk tolerance is the amount of specific risk an organisation may accept for data breaches in particular.
ISO 31000 Framework for Indian Cricket While it may appear that these are all just the costs of doing business in India, I don’t think this is true. Also, other sports systems facing similar uncertainties—pandemics, extreme weather, terrorism, financial volatility—don’t operate this way. They use formal risk management frameworks to decide what to avoid, what to mitigate, what to insure, and what to accept. ISO 31000 is one such framework, and it’s suited to complex, multi-stakeholder systems like Indian cricket. Here it is applied to Indian cricket:
Venue operators: own stadium safety, crowd management, emergency response.
Communication & consultation
Regular briefings with teams, broadcasters, police, local authorities.
Clear public communication on cancellations, rescheduling, and safety decisions.
Monitoring
Track near‑misses (e.g. small crushes at gates, close calls with fog or heat).
Maintain dashboards: incidents per season, delays, injuries, corruption alerts.
5. Review & Continuous Improvement (What Did We Learn This Season?)
After each season / major incident:
Incident reviews
IPL suspension: What early warning signs did we miss? Could we have acted sooner?
Chinnaswamy stampede: Which design and process failures led to casualties?
Lucknow fog‑out: How should scheduling rules change for fog‑prone venues?
Mustafizur threats: How do we handle politically sensitive players and venues?
Effectiveness checks
Did our treatments reduce likelihood or consequence as expected?
Did any controls fail or create new risks (e.g. over‑policing crowds)?
Update the system
Revise risk criteria, appetite, and tolerances where needed.
Amend scheduling policies, venue standards, insurance terms, and contracts.
Feed lessons into next season’s planning: same framework, better parameters.
To-Do List If Indian cricket embraced systematic risk management, the BCCI would have:
A Risk Management Policy (BCCI document) establishing appetite and tolerance
A Risk Register (updated quarterly) tracking all relevant risk categories with assessed severity and treatment strategies
Incident Response Protocols that trigger automatically (e.g., if weather forecast shows fog, reserve dates activate; if geopolitical tension rises, security protocols engage)
Venue Certification requiring regular safety audits for all stadiums
Insurance covering defined scenarios with unambiguous language
Player Education on corruption risks, mental health impacts of uncertainty, safety protocols
Stakeholder Transparency (fans, sponsors, broadcasters informed about residual risks and mitigation strategies)
Continuous Learning (post-incident reviews feeding into policy updates)
Why bother? Risks are interconnected: geopolitics affects scheduling, which affects logistics, which affects player welfare, which affects performance, which affects revenue. One shock propagates through the entire system.
But the real argument is how all this affects BCCI’s income: In fiscal year 2024-25, the BCCI earned a total of ₹20,686 crore—double what it was five years earlier. But this income doesn’t flow uniformly. It comes from multiple sources, each vulnerable to different risks:
IPL: ₹5,761 crore (59.1% of FY 2024-25 BCCI revenue)12
International cricket (men’s): ₹361 crore (3.7%)12
Created cascading effects on domestic Ranji Trophy schedules
Disrupted team preparation windows for the Asia Cup (subsequently postponed)
When the IPL shut down due to the events that followed the Pahalgam terrorism, one risk event rippled across all BCCI’s operations. The ₹3,500-4,000 crore total ecosystem loss wasn’t borne by IPL alone—it distributed across broadcasters, sponsors, franchises, international teams visiting India, and state cricket associations that depend on BCCI’s distributions (approximately ₹100-125 crore in combined sponsorship, broadcast, and match-day revenue for 16 matches15 and the broadcaster JioCinema faced losses of ₹1,900-2,000 crore (35% of their ₹5,500 crore seasonal projection)17 While war is a systemic risk (read more here, scroll down to the risk sections), a stampede at a celebration event is not.
Now let’s do some hypothetical maths. Let’s say of BCCI’s total ₹20,686 crore exposure, 10% is under difficult-to-avoid-risk, and another 20% are things that could go wrong but if everything happened normally (planes flew on time, luggage was not lost, people had common sense, etc.) it would not go wrong. Now assume costs of mitigation to be between 10-20% of the cost of losses. This would be the breakdown of that exposure:
Risk Category
% of Total Exposure
Exposure Amount (₹ Crore)
Annual Loss Probability
Expected Annual Loss (₹ Crore)
Mitigation Cost (10-20% of loss)
Net Benefit if Mitigated
High Risk (Geopolitical, Corruption, Major Infrastructure)
10%
₹2,068.6
20-30%
₹414-620
₹41-124
₹290-579
Medium Risk (Weather, Logistics, Personnel, Sponsorship)
20%
₹4,137.2
30-40%
₹1,241-1,655
₹124-331
₹910-1,531
Low Risk (Normal operations)
70%
₹14,480.2
1-5%
₹145-724
₹15-145
₹130-709
TOTAL
100%
₹20,686
~15-20% aggregate
₹1,800-3,000
₹180-600
₹1,200-2,820
Now let’s do scenario analysis with ILLUSTRATIVE NUMBERS.
Scenario A – No Mitigation (Do Nothing)
Element
Amount (₹ Crore)
Notes
Reserves/ Bank Balance
₹20,686
Baseline
Expected Losses (unmitigated)
₹1,800-3,000
From Table 1
Insurance Recovery (40-50% of losses)
₹720-1,500
Partial coverage; war/corruption not covered
Net Loss After Insurance
₹1,080-2,280
Uninsured exposure
Effective Revenue After Losses
₹18,406-19,606
Revenue minus net loss
Annual Cost to Organization
₹0
No prevention investment
Net Outcome
₹18,406-19,606
Revenue minus losses
Scenario B – Full Mitigation (Invest in Risk Management)
Element
Amount (₹ Crore)
Notes
Reserves/ Bank Balance
₹20,686
Baseline (unchanged)
Mitigation Investment
₹180-600
Cost to prevent/reduce losses
Expected Losses (with mitigation)
₹450-900
Reduced by 60-75% through mitigation
Insurance Recovery (40-50%)
₹180-450
Still applicable, lower losses
Net Loss After Insurance & Mitigation
₹270-450
Dramatically reduced
Effective Revenue After Mitigation & Losses
₹20,236-20,416
Revenue minus mitigation cost and net loss
Annual Cost to Organization
₹180-600
Mitigation investment
Net Outcome
₹20,236-20,416
Much better than Scenario A
None of the above means that BCCI doesn’t do risk mitigation at all. They must do. Matches are insured, security is coordinated with state authorities, schedules are adjusted, and contingency plans exist. But much of this risk management remains reactive, fragmented, and event-specific, rather than systematic.
The scale of Indian cricket has outgrown this approach. What is now a ₹20,000-crore ecosystem operates across volatile geopolitics, increasingly extreme climate conditions, aging infrastructure, fragile logistics, and intense public scrutiny. In such an environment, risk does not arrive as isolated shocks. It propagates. A fog-out affects scheduling, which affects logistics, which affects player welfare, which affects performance, which ultimately affects revenue and credibility. Treating each disruption as an unfortunate exception misses the underlying structure of the problem.
Active risk management does not promise certainty, nor does it eliminate risk. What it offers is clarity: an explicit understanding of working to anticipate risks in our cricket system so that most can simply be prevented, and those that cannot be prevented are mitigated. The IPL did not need to be part of India’s war theatre. After the Pahalgam attacks those matches could have been shifted to lower risk areas, such as away from the border, and we wouldn’t have had Ricky Ponting trying to persuade foreigners to stay back and play.18
Risk of an event = Probability of the event happening × the consequensces of the event happening.1
To understand probability better, please read this and this.
This is the most basic definition of Risk. Risk = Probability, or how likely an event is to occur × Consequence, or impact. Because it is multiplicative, a high-probability event with low consequence (losing a pen) is low risk, and a low-probability event with catastrophic consequence (say, a nuclear exchange) can be high risk. The danger zone is where meaningful probability meets serious consequence.
History For most of history, people spoke about fate, luck, or divine will, not “risk” in a calculable sense. Hazards (storms, plagues, crop failures) were seen as acts of gods or nature. There was no notion of systematically measuring uncertainty.
In the 17th Century, A French nobleman, Chevalier de Méré, asked Blaise Pascal why some gambling bets worked better than others. Pascal’s correspondence with Pierre de Fermat (1654) is widely seen as the birth of modern probability theory.23 They developed early ideas of expected value – essentially, the mathematical ancestor of “probability × impact”.4
In the 18th Century, Daniel Bernoulli introduced the idea of utility in 1738:5 the insight that losing or gaining the same amount (£100) does not feel equally important to rich and poor people. This work planted the seeds for understanding why humans are risk‑averse and set the stage for later behavioural theories.
As trade, shipping and life insurance developed in the 18th–19th centuries, people started using probability tables to price the risk of death, shipwrecks and fire.6 This was the first large‑scale, institutional attempt to put numbers on everyday risks and pool them.6 Risk pooling is when lots of people chip in a little money into a shared pot (the “pool”) so that when one person has a big, unexpected cost (like a car accident or sickness), the money from the whole group covers it, making big losses manageable for individuals and premiums more stable for everyone.7 After industrialisation, wars and technological disasters, “risk” broadened from individual hazards (a ship sinking) to complex systems (nuclear power, financial markets, supply chains). The language of “risk management” emerged after the Second World War and matured through the later 20th century, culminating in general standards such as ISO 31000.89
Expected Value910 The mathematical heart of risk is Expected Value (EV). This is simply the average outcome if you repeated an action infinitely.
If a bet offers a 50% chance to win £100 and a 50% chance to lose nothing, the Expected Value is £50 ($0.50 \times 100 + 0.50 \times 0$). Rationally, you should pay anything up to £49.99 to take that bet.
But real life isn’t a casino with infinite replays. Humans often get only one shot. If an individual takes a risk with a positive expected value—like cycling to work to save money and improve health—but gets hit by a bus on day one, the “average” outcome is irrelevant. This is why variance matters as much as the average. A risk might look good on paper (high expected value) but have a “ruin condition” (a consequence you can’t recover from) that makes the math irrelevant.
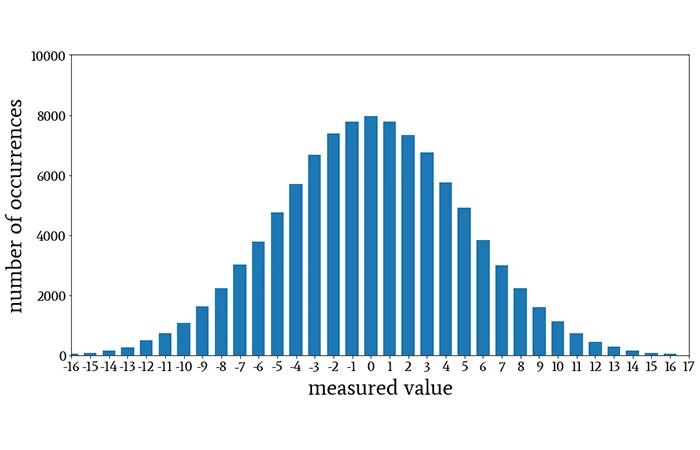
Normal Distribution If you measured the height of every single individual on the planet, or even a representative sample of them, the shape of that graph (often called “curve” in academic language) would be similar to this image:
This is the Normal Distribution (or Bell Curve), and it is the most important shape in risk management.12 It describes how randomness usually behaves. The very top of the hill represents the Mean (the average). This is what you “expect” to happen; in our stadium example, this is the average height (say, 5’9″). The vast majority of people will be average height, so their heights will be recorded as being clustered right around the middle.
If the Mean tells you where the peak is, Variance tells you how wide the hill is. It is a statistical measure showing how spread out a set of data points are from their average.13
Low Variance: Imagine a hill that looks like a needle. This means data points are tightly clustered. If you measured the height of 10,000 professional jockeys, the variance would be low—almost everyone is close to the average.14
High Variance: Imagine a hill that looks like a flattened pancake. This means data is widely spread out. If you measured the height of a random crowd containing jockeys and basketball players, the hill would be very wide.15
In risk management, mean tells you what usually happens; variance measures unpredictability and the potential for outcomes to be very different from the average, which is the essence of uncertainty.1617 A high variance means numbers are widely scattered, increasing the chance of both extreme positive and, crucially, extreme negative outcomes (losses).18 Low variance indicates they are clustered closely around the mean: it quantifies the dispersion or variability within a dataset.18 In the height data set, while most people would be average height, some people would be very short and others very tall as well. It’s just that the number of people who are not close to the average would fall off the farther away we get from the mean, or the middle of the bell curve.
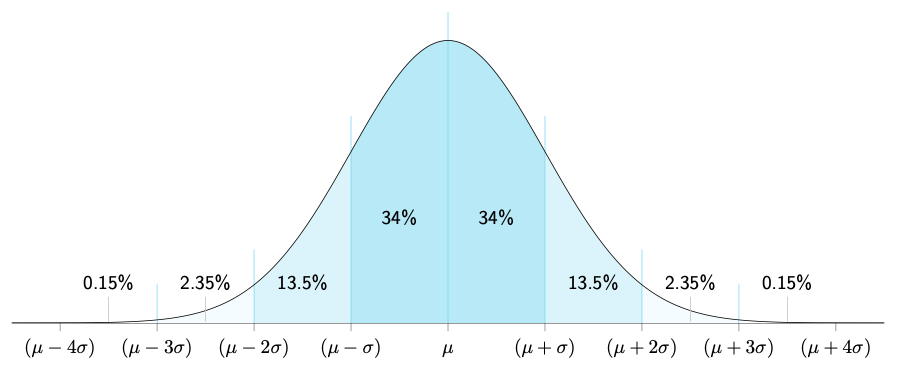
Normal Distribution divided into standard deviations distances from the mean.20
If Variance tells you the hill is “wide,” Standard Deviation (Sigma, or σ) tells you exactly how wide in real units. It is simply the square root of variance.
Think of Standard Deviation as the ruler for the Bell Curve.
1 Standard Deviation: In a normal distribution, about 68% of all outcomes happen within one standard deviation of the mean. If the average height is 5’9″ and the standard deviation is 3 inches, 68% of men are between 5’6″ and 6’0″.
2 Standard Deviations: Go out a bit further, and you capture 95% of all outcomes.
3 Standard Deviations: Go out three steps, and you capture 99.7% of everything.
In risk, when someone talks about a “Six Sigma” event (six standard deviations away from the average), they are talking about something so rare that it should theoretically almost never happen. And yet, in financial markets and complex systems, these “impossible” events happen surprisingly often.
Confidence2122 If a bank says, “We are 95% confident we won’t lose more than £1 million tomorrow,” they are essentially saying: “If tomorrow is a normal day (one of the 95%), we are safe. But if tomorrow is one of those rare, 1-in-20 bad days, all bets are off.”
In statistics, confidence is often explained using confidence intervals: at a 95% confidence level, the method used to build the interval would capture the true value about 95 times out of 100 repeated samples. That does not mean the true value has a 95% probability of being inside this specific interval; it means the procedure has 95% long-run reliability. This means, confidence intervals speak about frequency: how often do the unexpected or unwanted events happen. At 95%, they happen on any 5 days out of 100. at 99%, they happen once every 100 days.
For risk management, think of confidence levels as a dial for paranoia:
95% Confidence: You are planning for the normal bad days. You accept that on 1 day out of every 20 (roughly once a month), you will breach your limit.
99% Confidence: You are planning for the severe days. You only accept breaching your limit on 1 day out of 100 (roughly 2–3 times a year).
99.9% Confidence: You are planning for near-disaster. You only accept a breach once every 1,000 days (roughly once every 4 years).
The Micromort In the 1970s, Stanford professor Ronald Howard needed a way to compare diverse risks like skydiving, smoking, and driving. He invented the Micromort—a unit representing a one-in-a-million chance of death.23
This equalises different activities. Instead of vague fears (“is it safe to fly?”), we can use units:
1 Micromort is roughly the risk of driving 250 miles (400 km).24
1 Micromort is also the risk of flying 6,000 miles (9,600 km).24