Risk – V: The Strait of Hormuz and The Price of Uncertainty

If you’ve been following this blog’s series on risk, you know by now that risk isn’t just something that happens on a trading screen or inside a bank. Risk lives in the real world — in weather patterns, in election results… and also clearly in the Strait of Hormuz.

Geography
The Strait of Hormuz is a narrow oceanic passage connecting the Persian Gulf to the Gulf of Oman and, from there, to the rest of the world’s oceans. It is bordered on the north by Iran and on the south by the UAE and Oman.1 At its narrowest, it is just 21 nautical miles wide, with the navigable shipping lanes only about 2 miles wide in each direction.2

Importance
Through this bottleneck flows roughly one-fifth of all global petroleum liquids, which is approximately 21 million barrels per day of crude oil and condensates.3 UNCTAD puts it at around a quarter of all global seaborne oil trade.4 The daily value of oil and LNG transiting the Strait is estimated at over $1.3 billion.5 Annually, trade flows worth approximately $1.2 trillion from five Gulf countries (Iran, the UAE, Qatar, Kuwait, and Bahrain) depend on this waterway remaining open.5

So, if this strait is blocked for one single day, between US $2 and $2.3 billion worth of oil trade will be disrupted.6

Update, if you live under many rocks
The strait has been blocked since Israel and USA decided to start bombing Iran on 28 February 20267, with the Strait formally closing to most traffic by 4 March8 (aside: I feel like March has lasted for 84 years).

Risk
In previous posts on this blog, we’ve talked about risk as the possibility that something unexpected happens, and that the unexpected thing costs you something910 (because when it gifts you something, you’re happy- we only tend to be worried when something bad happens, not when something nice happens by accident/ through uncertainty). That cost could be money, time, safety, or opportunity. But the key insight is always this: risk is not just about bad outcomes. It’s about uncertainty itself.11

Finance has a more precise definition. In financial markets, risk is typically measured as the volatility of returns (how much a price, yield, or value might swing from its expected level).12 But risk also has a tail dimension1314: the small-probability, catastrophic events that are hard to price and even harder to hedge (hedging is a risk management strategy where you take the opposite position from an asset you already own so that if the first asset reduces in value, the opposite hedged position will experience the exact opposite and either maintain value or increase in value, which allows the entity that is using hedging as a strategy to continue to be part of the market rather than sell the first asset which is facing volatility, while also not losing everything if its value falls sharply. It involves the cost of buying the opposite asset, so it is a kind of insurance)15. The Strait of Hormuz is the textbook example of this second kind of risk. It sits in the tail, but when the tail wags, it apparently wags the whole dog with it.

Geopolitical Risk Premium (GRP)
Geopolitical risk is the threat, occurrence, or escalation of adverse events, such as wars, terrorism, and international tensions, that disrupt global relations, economies, and supply chains.1617

Every time tension rises in the Gulf, the price of oil goes up- even before a single barrel is disrupted.18 This is called the Geopolitical Risk Premium (GRP): the extra cost added to the price of oil simply because the possibility of disruption exists.19

In early 2026, Oxford Economics estimated this premium at approximately US $9 per barrel.520 That means every barrel of oil being bought and sold globally was US $9 more expensive than it would be in a world without Hormuz tension, and not even because supply had actually been cut, but simply because markets were pricing in the possibility that it might be.

As we know, this is a foundational concept in risk and risk management: people pay for uncertainty (this is how insurance works as a business, for example).2122 The premium is the market’s way of costing the uncertainty of not knowing what will happen, whether for a term life insurance (which actuarial nerds actually know a lot about) or about Iran closing the Strait of Oil: we don’t know what will happen, and that not-knowing is worth something (priced as the premium).2324

Scenario Analysis
Oxford Economics published a scenario analysis in February 2026 that laid out how it was thinking about Hormuz risk:5

  • 20% probability of faster de-escalation, where the risk premium unwinds quickly
  • 45% probability of the Strait stays open, flows remain broadly normal
  • 30% probability of low-level disruption, where repeated interference cuts vessel traffic by 50% for two months, reducing global oil supply by 4 million barrels per day
  • 5% probability of severe disruption, where Iran halts transit for up to a week, pushing oil to $140 per barrel and gas above $40 per MMBtu

So, according to Oxford Economics, the most likely scenario was that nothing would go drastically wrong. Still, that 30% scenario of low-level disruption is not a small number. In finance, a 30% probability event is something you plan for, hedge against, and price into your decisions. And then the 5% tail event happened. In risk-speak, this is called a Grey Rhino24– a highly probable, high-impact threat that is visible and repeatedly warned about but neglected anyway, because acting on it costs money now, and the event is only probable, not certain.

Insurance
One of the most sensitive early-warning signals of financial risk is insurance pricing, because when something becomes riskier, insurers reprice insurance to cover both, the rising uncertainty, and the total risk.25 They’re basically trying to cover all major possibilities that they’ll have to pay you rather than you either swallowing the losses, or you paying them.

Therefore, war risk insurance premiums for ships transiting the Strait have been surging26, which means that freight rates for oil tankers have spiked. Marine fuel costs are rising too, layering cost upon cost.27 Maritime insurance companies have the incentive to be ahead of the news, not behind it.28 When they start repricing risk aggressively, or worse, when they start withdrawing cover entirely, ships that are theoretically able to transit the Strait become practically unavailable because they can’t afford or obtain insurance.2930

This is not the first time insurance has been the mechanism that shut down a shipping lane. When Houthi attacks began in the Red Sea in late 202331, the persistent collapse in traffic wasn’t primarily because ships were being sunk- it was because the threat alone made insurers reprice, which made shipowners reroute. War risk premiums for Red Sea voyages rose from effectively zero to between 0.5% and 1.0% of a ship’s hull value, and major carriers including Maersk, MSC, Hapag-Lloyd, and CMA CGM suspended transits entirely, not because their ships couldn’t physically pass, but because the insurance mathematics no longer worked.32 By late 2024, S&P Global reported that Cape of Good Hope reroutes were likely to “persist well into 2025”, and they did.33 The Hormuz closure is the same mechanism, at a far larger scale.

Cascading Effects
A cascade effect is a sequence of events in which each event produces the circumstances necessary for the initiation of the next event.34 Here are some impacts that we’re all seeing these days:

  • Higher oil prices are a tax on everything. They raise the cost of transportation, manufacturing, petrochemicals, and heating- essentially every sector of the modern economy.3536
  • Qatar, the world’s largest LNG exporter, ships nearly all its gas through Hormuz. Any disruption to LNG flows hits Europe, Japan, South Korea, and increasingly India. These are countries that have been restructuring their energy systems around gas as a “transition fuel.”3738
  • Fertilisers are made from natural gas and other petrochemical inputs. The Gulf is a major producer. If fertiliser shipments are disrupted, the cost of growing food goes up. Planting decisions change. Crop yields fall, with the most severe consequences falling on developing economies.39
  • When ships can’t transit the Strait (or won’t, because insurance costs make it uneconomical) they have limited alternatives. The next-best option is to go around the Cape of Good Hope at the southern tip of Africa, which adds roughly 3,500–4,000 nautical miles and about 10–15 days to the journey.4041 That means more fuel, higher crew costs, slower delivery times, and, crucially, fewer ships doing more work: Before the crisis, around 150 vessels transited the Strait each day; that figure has since fallen to four or five. The result could be a supply-side squeeze in global shipping capacity.42 Freight rates rise not just for oil tankers but for cargo ships, container ships, and bulk carriers.42 These higher costs flow through to the price of every manufactured good that depends on components, materials, or energy from the Gulf region.
  • When oil prices spike, petro-dollar economies gain. Gulf sovereign wealth funds get richer.4344 The US dollar often strengthens (since oil is priced in dollars).45 But for oil-importing nations, the impact is brutal: India, for instance, imports over 85%46 of its crude oil, and while it has diversified47 supply routes in recent years, roughly 40%48 of crude imports and 90%48 of LPG imports still transit the Strait. When the Strait closed, the government was forced to issue emergency orders directing refineries to maximise domestic LPG production to stop cooking gas running out in households.48 A sustained oil price spike means a widening current account deficit,49 a weaker rupee,50 imported inflation, and growing pressure on the Reserve Bank of India to raise interest rates(to curb inflation and defend the currency because raising interest rates increases borrowing costs for consumers and businesses, reducing demand and slowing down economic activity, which helps bring inflation down): even if the domestic economy doesn’t otherwise warrant it.
  • The cost of jet fuel has more than doubled since the Strait closed.5152 The cost to airlines is estimated at $11 billion53 in additional annual fuel costs, which will show up in your flight bills, but also in the cost of any items being transported through air, including, for example organs for transplant54 (that’s right, it won’t just impact Amazon deliveries).
  • UNCTAD555657 explicitly warned that high debt burdens and rising borrowing costs limit these countries’ ability to absorb new price shocks. When energy bills go up and borrowing costs rise simultaneously, governments face impossible choices: cut subsidies, raise taxes, or default.
    • To understand why, you need to know one thing about how developing-country debt works: a significant amount of the $11.458 trillion in external debt owed by developing countries is denominated in US dollars. This means that while these governments collect their taxes and revenues in their own local currencies they must repay their loans in dollars, a currency they don’t control and can’t print.59
    • When oil prices rise and economic conditions worsen, local currencies tend to weaken against the dollar.6061 Think of it this way: if your salary is paid in rupees but your rent is charged in dollars, and the rupee suddenly buys fewer dollars than it did last month, your rent just got more expensive, even though the dollar amount didn’t change. That is exactly the position these governments are in. The debt didn’t grow; their money just became worth less, making the same debt harder to pay.56
    • The result is a brutal squeeze from three directions at once: energy bills going up, borrowing costs rising, and debt repayments consuming an ever-larger share of government revenue in real terms.57 When a government is spending a significant portion of what it earns just to service debt it took on years ago, there is almost nothing left for the things governments are supposed to do: run schools, staff hospitals, maintain roads, and protect its most vulnerable people.62 Please note: currently 3.4 billion people live in countries already spending more on debt than on health or education.6362
  • When oil prices spike, the standard central bank response is to raise interest rates to fight inflation, but higher rates, combined with rising energy costs, create the nightmare scenario of stagflation64– the sepulchral portmanteau of stagnation + inflation: economies are not growing, are even contracting, and then being hit with inflation.65 The 1970s oil shocks produced exactly this scenario, and most Western economies spent nearly a decade fighting it.6667

What happens next?
As of April 12, 2026, US-Iran talks in Islamabad collapsed after 21 hours without a deal68, and Trump has announced a naval blockade of the Strait.69

According to CNBC’s analysis of oil-shock-induced bear markets, the average duration of a market decline caused by an oil shock is approximately 13 months, with an average drop of around 30%.70 But the range is enormous, and duration, more than any other variable, determines how much lasting damage gets done.70 Allianz Research has already stated plainly: if the Strait remains blocked for more than three months, the impact on global growth will start to be recessionary.71 Global GDP growth for 2026 has already been revised down to 2.6%, from 3.1% projected before the conflict.71

However, the thing to note is that even if the Strait reopens, the effects don’t simply switch off.

Insurance premiums, once repriced upward, tend to stay elevated for years.7273 This is because the risk hasn’t gone away once the issue has been resolved, it has simply been revealed: that is, now people know, and Iran knows, and people know that Iran knows, that they can do this any time they wish to. Iran has even begun charging transit tolls to ships seeking passage, a development that, if it stands, converts a one-time crisis into a permanent feature of the global shipping cost structure.74

Secondly, shipowners who rerouted through the Cape of Good Hope have restructured their logistics, signed new contracts, and reoriented supply chains that won’t simply snap back the moment a ceasefire holds.7576 The IFO Institute forecasts that Germany, which is used as a proxy for industrial Europe, will still see the drag from the war on its GDP growth through 2027, even in the de-escalation scenario.77 The inflation spike from Q2-Q3 2026 has already been priced in by Allianz, and that won’t change just because the Strait opens.78

There is also the question of what the world does with the lesson. Every oil shock in history has accelerated investment in energy alternatives.7980 The 1973 embargo triggered the first serious wave of Western investment in nuclear power and efficiency standards.81 The 2026 shock has already prompted urgent conversations about alternative pipelines, renewable acceleration, and LNG infrastructure diversification.8283 These structural responses will, eventually, reduce the world’s dependence on this chokepoint: but they operate on decade-long timescales, not quarterly ones.84

In the shorter term, the most honest answer is: nobody knows64, and we’re all paying the cost of not knowing.85 The financial markets’ best guess, reflected in options pricing and analyst forecasts, is that there is a meaningful probability of both a relatively contained outcome and a prolonged, recessionary one.8687 The uncertainty itself has a cost, as we’ve now established. And that uncertainty will remain priced into everything. This is the architecture of systemic risk. It doesn’t ask for your involvement. It doesn’t need you to have invested in oil futures or to have taken a position on Iranian politics. It just needs the world to be as interconnected as it is.

Sources

  1. Strait of Hormuz: Geography & Key Facts — Strauss Center
  2. World Oil Transit Chokepoints — U.S. Energy Information Administration
  3. Key Figures for the Strait of Hormuz — Statista
  4. Hormuz Shipping Disruptions Raise Risks for Energy, Fertilizers and Vulnerable Economies — UNCTAD
  5. Iran and the Strait of Hormuz: Risks to Global Energy Prices — Oxford Economics
  6. Prolonged Closure of the Strait of Hormuz Could Severely Disrupt Global Supply Chains: Study — Down to Earth
  7. Iran-Israel-US War: How It Unfolded — The New York Times
  8. Strait of Hormuz Closes to Most Shipping Traffic — BBC News
  9. Risk Management and Insurance: Defining Risk — Flat World Knowledge / Baranoff
  10. Probability, Risk and Uncertainty — Cambridge Judge Business School
  11. The Difference Between Risk and Uncertainty in Finance — CME Group
  12. Understanding the Difference Between Volatility and Risk for Smarter Investments — NISM
  13. Tail Risk Explained: Managing Rare Events Leading to Portfolio Losses — Investopedia
  14. Tail Risk — Explained — Financial Edge Training
  15. What Is Hedging and How Does It Work? — TD Bank
  16. Measuring Geopolitical Risk — Federal Reserve International Finance Discussion Paper No. 1222
  17. Measuring Geopolitical Risk — Caldara & Iacoviello, American Economic Review (2022)
  18. Geopolitical Risk and Oil Prices — European Central Bank Economic Bulletin
  19. Higher Geopolitical Risk Premium in Oil Price Partly Offsetting Market Weakness — Fitch Ratings
  20. 6 Ways to Manage Risk and Uncertainty in Insurance — Informa Connect
  21. Understanding the Volatility of Experience and Pricing Assumptions — Society of Actuaries
  22. Using Actuarial Science to Decode Risk — Smith Hanley Associates
  23. ASOP No. 54: Pricing of Life Insurance and Annuity Products — Actuarial Standards Board
  24. Decoding the Zoo of Risks: Black Swan, Grey Rhino, White Elephant & Black Jellyfish — IRM India
  25. How the Middle East War Is Turning Governments into Insurers of Last Resort — World Economic Forum
  26. Maritime Insurance Premiums Surge as Iran Conflict Widens — Reuters
  27. Fears Mount on Ship Fuel Availability as Hormuz Closes — Kühne+Nagel
  28. War in West Asia: As Ships Halt Hormuz Transits, Why Insurers Are Pulling Cover — The Indian Express
  29. Maritime Insurers Cancel War Risk Cover in Gulf as Iran Conflict Disrupts Shipping — The Guardian
  30. How the Middle East War Is Turning Governments into Insurers of Last Resort — World Economic Forum
  31. Red Sea Shipping Route Disruption Causes Diversions via Cape of Good Hope — SteelOrbis
  32. More Big Shipping Firms Stop Red Sea Routes After Attacks — BBC News
  33. Cape of Good Hope Reroutes Likely to Persist Well into 2025 as Industry Adapts — S&P Global
  34. Cascade Effect — Encyclopedia.com
  35. Oil Prices and the Global Economy — IMF Working Paper
  36. On the Impact of Oil Prices on Sectoral Inflation — IZA Institute of Labor Economics
  37. This Is What Happens When the Gas Runs Out — The New York Times
  38. Qatar LNG Tankers Make First Move Through Hormuz Since War Began — OilPrice.com
  39. FAO Chief Economist Warns of Severe Global Food Security Risks from Disruption to Strait of Hormuz — UN Food and Agriculture Organisation
  40. Shipping Companies Reroute Around Africa: The $8 Billion Monthly Cost — The Middle East Insider
  41. ME11 & MECL Rerouted via Cape of Good Hope — Maersk
  42. Hormuz Crisis Chokes Shipping, Sends Freight Rates Soaring Fivefold — The Hindu BusinessLine
  43. The Gulf Is Flexing Petrodollar Power and Learning Its Limits — Bloomberg
  44. The Dance of Oil and the US Dollar — Zerodha Daily Brief
  45. Oil Shock Hits Different in a World of Shrinking Petrodollars — Thornburg
  46. India, Hormuz, and the Imperative of Energy Diversification — Energy Connects
  47. Strait of Hormuz and India’s Oil Supply Diversification Strategy — India Briefing
  48. Energy Supplies Remain Secure: Government Statement on India’s Oil and LPG Imports — Press Information Bureau of India
  49. Impact of Rising Crude Oil Prices on India’s Economy — Axis Direct Research
  50. RBI to Hold Repo Rate at 5.25% in April 2026 Amid Inflation Fears — Multibagg
  51. Air Fares to Surge as Jet Fuel Prices Remain High Despite Ceasefire — The National News / IATA
  52. Jet Fuel Prices Double amid Strait of Hormuz Blockade Paralyzing Supply Flows — Anadolu Agency
  53. Jet Fuel Crisis: Strait of Hormuz Chokepoint Sparks $3.95/Gallon Surge and $11 Billion Annual Cost Risk to Airlines — Ainvest
  54. When Minutes Matter: The Issues at Stake in Organ Transportation — UNOS
  55. Strait of Hormuz Disruptions: Implications for Global Trade and Development — UNCTAD Official Document
  56. Strait of Hormuz Disruptions: Growth and Financial Implications — UNCTAD Official Document
  57. Hormuz Disruption Deepens Global Economic Strain Across Trade, Prices and Finance — UNCTAD
  58. Debt Crisis: Developing Countries’ External Debt Hits Record $11.4 Trillion — UNCTAD
  59. Rising Oil Prices and Developing Country Debt: The Next Shock Is Already Here — Boston University Global Development Policy Center
  60. The Link Between Oil Prices and the US Dollar — European Central Bank
  61. Not All Emerging Markets Are Equal: Hormuz, Triple Deficits and the Energy Price Premium — Allianz Trade
  62. A World of Debt 2025 — UNCTAD
  63. UN Warns of Soaring Global Public Debt: 3.3 Billion People Now Live in Countries Where Debt Interest Payments Exceed Health or Education Spending — United Nations
  64. Oil Still Dictates Inflation and Confuses Central Banks — NDTV Profit
  65. Slow But Not Steady: The Fight Against Stagflation in the 1970s — Georgetown University Law Center
  66. The Oil Shocks of the 1970s — Yale Energy History Programme
  67. What Was the 1970s Oil Crisis, and Are We Heading for Something Worse? — BBC News
  68. US-Iran War Negotiations Collapse — The New York Times (Video)
  69. Trump Orders Strait of Hormuz Naval Blockade — CBC News (Video)
  70. Here’s How Long the Three Oil-Shock-Induced Bear Markets Lasted — CNBC
  71. Allianz Economic Outlook: Consequences of the Iran War — Allianz Research
  72. India Plans Sovereign Guarantees for Insurers as Iran War Heightens Shipping Risks — Reuters
  73. Marine and Aviation War Risk Premiums Rise as Insurers Reassess Exposure — Lockton
  74. Tehran’s ‘Toll Booth’: How Iran Picks Who to Let Through the Strait of Hormuz — Al Jazeera
  75. Why Reopening the Strait of Hormuz Won’t Be Enough to Solve Shipping Woes — CNN
  76. 34,000 Shipping Routes Diverted from Hormuz Disruption — FreightWaves
  77. ifo Economic Forecast Spring 2026: Consequences of the Iran War Dampen Recovery — ifo Institute
  78. Energy Price Shock Dampens Recovery — Inflation Rises — Kiel Institute
  79. 50 Years After the 1973 Arab Oil Embargo: Chaos in Energy Markets Then and Now — Baker Institute, Rice University
  80. Oil Embargo and Energy Crises of 1973 and 1979 — EBSCO Research Starters
  81. Energy Security Lessons From the Oil Crises — and Nuclear Power’s Strategic Return — RUSI
  82. Where Else Can the World Get Energy After Iran’s Blockade of Hormuz? — Forbes
  83. The Blue Flame Chokepoint: Strait of Hormuz Disruption Sends Global LNG Markets into Turmoil — Wedbush Securities
  84. Hormuz Closure and the Real Acceleration of Energy Alternatives — Renewability
  85. Oil Market Gripped by Record Volatility and Speculation Since Start of Middle East War — Le Monde
  86. Iran War: Oil Markets Brace for Wild Price Swings — Reuters
  87. Three Scenarios for the Global Economy and the Iran Crisis — ICIS
A note on traditional economics

Traditional, as opposed to Environmental Economics, which is a later discipline, and will be a later post.

Economics is the science of human choices, because resources are limited, but human wants are unlimited. This is why every individual, business, and nation must constantly answer one question: how do we allocate our limited resources? We must decide how much goes to needs (essential for survival) and how much to wants (additional desires). This inquiry forms the cornerstone of economic thinking and shapes how modern finance, banking, and capital markets function.12

Because resources are scarce, and each resource can be put to multiple uses, when we choose one thing, we sacrifice something else. This sacrifice is called opportunity cost—the value of the best alternative forgone when making any choice. This is pervasive. An hour of time can be spent cooking, sleeping, watching cricket, gardening, socialising, reading, eating, working out, or any number of other activities. If one activity is chosen, the satisfaction from the others becomes the opportunity cost of that choice.12

Opportunity costs exist at every scale- for each person, for each group of persons (such as a family, or a nation, or our entire species), and for each resource, so that a rupee spent on something is also a rupee not spent on something else. At all times, we are making two choices: how to use our resources, and therefore, how not to use them.12

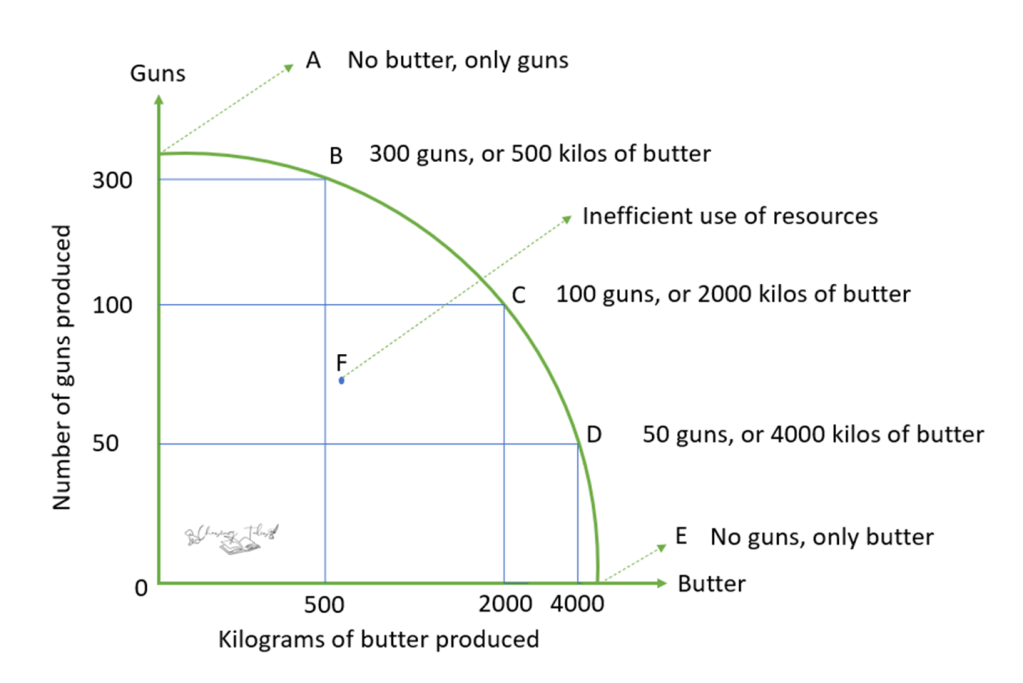
Imagine a hypothetical world where all resources can only be used to produce either ‘guns’ (military goods) or ‘butter’ (civilian goods). The more guns an economy produces, the fewer kilos of butter it can make, because resources are finite. This trade-off is represented by the Production Possibility Frontier (PPF), which shows all efficient combinations of the two goods. In an efficient economy, all resources must be used to produce either of these products, and when an economy chooses to produce less than it can, it is considered inefficient use of resources.34

Production Possibility Curve

Moving along the curve from more butter and fewer guns to more guns and less butter shows the opportunity cost: how many units of butter society must give up to produce one more unit of guns. That sacrifice is the opportunity cost of additional guns. Points outside the curve are unattainable with current resources and technology; they can only be reached if the economy grows or technology improves. Points inside it represent waste or unemployment, where some resources are idle or misallocated.34

Every economy must answer three fundamental questions:​15

What should be produced?: This is about the mix of goods and services: food vs. defence, education vs. luxury items, public infrastructure vs. private consumption.

  • In a market economy (capitalism), this question is largely answered by consumer demand and profit signals. If people are willing to pay more for smartphones than for pagers, firms produce smartphones.
  • In a centrally planned economy, the government decides: for example, a state plan might say “this year we will produce X tonnes of steel and Y units of tractors.”
  • In mixed economies (which is almost every modern country), markets decide most things, but governments step in for public goods and basic needs (roads, schools, defence, basic healthcare).

How should it be produced?: This relates to production methods, technology, and the combination of factors of production.

  • A labour‑abundant country might choose labour‑intensive methods (for example, more workers, fewer machines) because labour is relatively cheap.
  • A capital‑rich country might use highly mechanised production lines and automation.
  • Environmental policies can also play a role: stricter pollution laws might push firms toward cleaner but more expensive technologies.

For whom should it be produced?: This is about distribution: who gets the goods and services once they are produced?

  • In a pure market system, distribution is based largely on income and wealth. Those with higher incomes can command a larger share of output.
  • Governments modify this market outcome through taxes, subsidies, and transfer payments. Different societies choose different degrees of redistribution depending on their values about equity, efficiency, and fairness.

As with all things in economics, this model too is based on multiple assumptions and is a drastically simplified explanation of the real world:

  • Resources are fixed for the time period analysed
  • Technology does not change
  • The model shows only two goods for simplicity
  • All resources are fully and efficiently employed

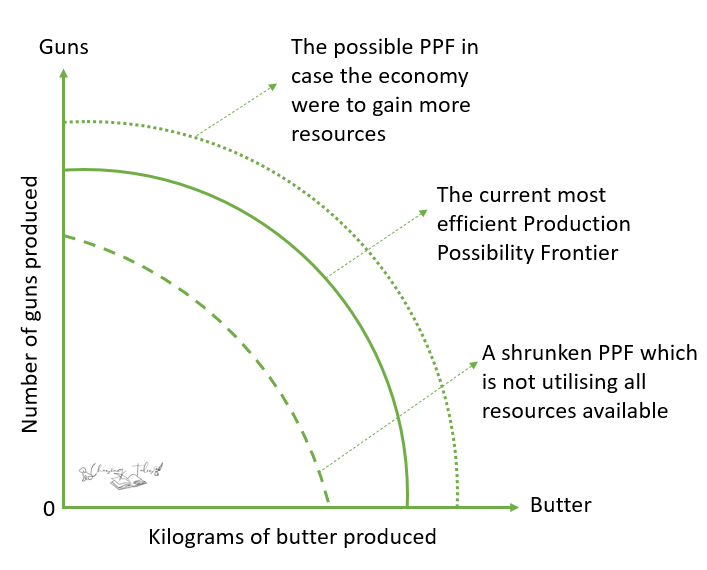
In the real world, economies grow over time as they acquire more resources (labour, capital) or develop better technology. This shifts the PPF outward, allowing production of more goods and services. Conversely, wars, natural disasters, or institutional collapse can shrink the PPF inward. Here’s a diagram depicting what happens to the PPF when such events occur:

An expanding or contracting Production Possibility Frontier

Factors of Production67
There are currently four accepted factors of production in economics: Land, Labour, Capital, and Entrepreneurship.

  • Land represents all natural resources, such as soil, water, minerals, forests, etc. The availability of these resources depends on a country’s location and directly influences which industries it can develop. A nation rich in oil has different economic opportunities than one with abundant forests or fertile farmland.​
  • Labour is the physical and mental effort people use to produce goods and services, including their skills, knowledge, and time. Education, training, the quantity of population, and workforce health directly impact a nation’s productive capacity.
  • Capital are the physical and financial resources used in production. Physical capital includes machinery, buildings, tools, and equipment that help workers produce more efficiently. Financial capital refers to the money available for investment in developing new factories, technologies, or infrastructure. A country with abundant capital can invest heavily in production facilities and research, accelerating economic growth.
  • Entrepreneurship is an intangible factor of production- the ability and willingness of individuals to take risks, innovate, and create new businesses. Entrepreneurs identify opportunities, combine the other factors of production in new ways, bearing risk and driving innovation and economic change.​

These factors of production interact with each other to create an economy.

Microeconomics891011
Microeconomics focuses on individual decision-makers such as consumers, workers, and businesses, and how they allocate their limited resources.

The key to understanding microeconomic behavior is the concept of utility. “Utility” is the satisfaction, happiness, or value a person receives from consuming a good or service. Imagine an individual is very thirsty. They therefore drink water, and gain satisfaction from their thirst being quenched. At this point they can continue drinking water if they are still thirsty, and continue to gain satisfaction. However, the second cup of water will not be as pleasant as the first. The third is likely to be even less so. This is the principle of diminishing marginal utility (in economics, “marginal” means additional): each additional unit of consumption provides progressively less satisfaction than the previous one, until a point is reached when zero additional utility is gained from consuming water (or whatever). After this point, marginal utility turns negative: if they keep consuming more water, they’ll get sick.

Diminishing marginal utility explains everyday consumer behavior. At each decision point, consumers unconsciously ask: “Is the satisfaction I’ll get from this additional unit worth what I’m paying for it?” When marginal utility (the satisfaction from one more unit) exceeds the price, consumers buy. When it falls below the price, they stop. This individual decision-making across millions of consumers creates the market’s total demand and helps determine market prices.

Microeconomics also examines production decisions. Businesses constantly ask: Should we expand production? Should we hire more workers? Should we invest in new equipment? These decisions depend on costs and expected revenues, which means they depend on whether the marginal benefit of an additional unit of production exceeds the marginal cost. A business expands as long as producing one more unit adds more to revenue than it adds to cost. When marginal cost exceeds marginal revenue, expansion stops.

Macroeconomics12131415
Macroeconomics studies the economy as a whole. It asks large-scale questions: Why do some nations grow faster than others? What causes inflation? Why does unemployment rise during recessions? How can governments influence these aggregate outcomes?​

Here’s a diagram:1617

The Circular Flow of Money

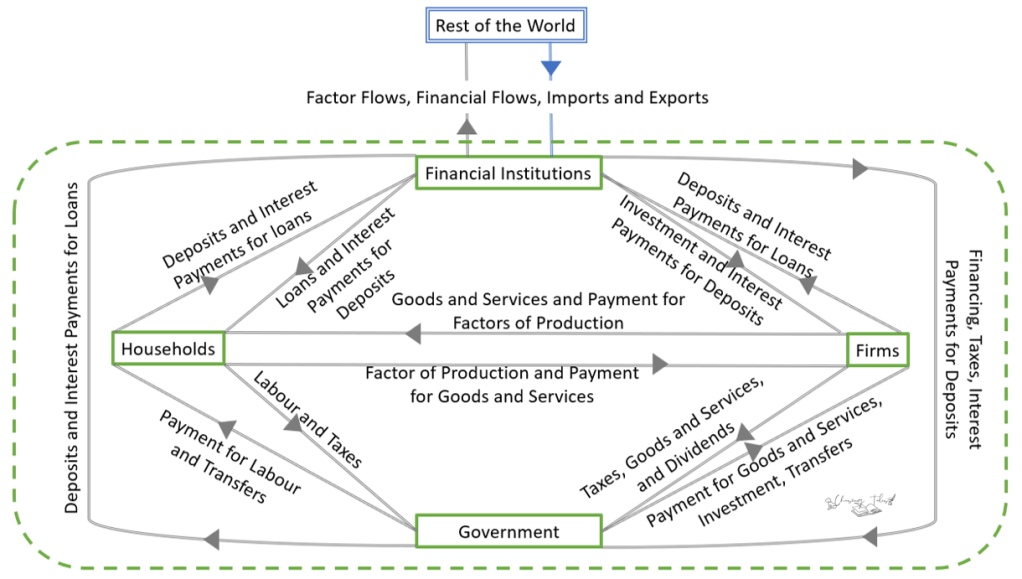
This diagram is called the ‘Circular Flow of Money’, and is a schematic representing the flow of money and goods and services in the economy.

Transfer payments are payments made by government (or sometimes private institutions) to individuals or businesses where no good or service is produced or exchanged in return. Unlike government purchases, which are payments for goods and services the government uses (like buying equipment or paying workers to build roads), transfer payments simply redistribute money from one group to another. The money is transferred from the government’s coffers (funded by taxes) to recipients who are then able to spend it into the economy. These payments are injections into household and firm budgets, and examples include unemployment benefits, lower or no cost medical facilities, food aid, business subsidies, etc.

There are five actors in this diagram: within an economy (inside the green dashed line), are Households, Firms, Financial Institutions, and Governments. Outside the economy being studied is the Rest of the World. Each country or economy in the world will have the same four actors according to this model.

  • Households are individuals and families who own the factors of production (land, labour, capital, and entrepreneurship) and consume goods and services. They supply labour to firms and government, provide capital to financial markets through savings, and spend their income on consumption.
  • Firms (businesses) are organisations that combine factors of production to create goods and services. They pay households for labour, borrow from financial institutions for investment, pay taxes to government, and trade with the rest of the world.
  • Government (local, regional, and national) collects taxes, provides public goods and services, makes transfer payments, employs workers, and uses financial markets to manage surpluses and deficits. They inject money into the economy through purchases, wage payments, as well as transfers/ redistribution, and withdraw money through taxation.
  • Financial Institutions (banks, investment firms, stock markets) accept savings from all sectors, provide loans and investment capital, facilitate all transactions in the economy, and connect domestic savers with both domestic and international borrowers.
  • The Rest of the World represents all international economic activity—foreign countries, their consumers, their businesses, and their financial institutions. It connects domestic economies to global trade and international capital flows.

Since this is a schematic, the circular flow is based on simplifying assumptions, and is in any case a theoretical snapshot. It does not explicitly capture:

  • Underemployment or unemployment
  • Inequality and wealth concentration
  • The detailed behaviour of governments and financial institutions
  • Financial crises or speculative bubbles

The fundamental exchange of labour and capital flowing from households to firms, while goods and wages flow back represents the engine of the economy. One person’s spending becomes another’s income, creating a self-sustaining circular motion. When you buy groceries, you become income for the store’s employees, the farmer, the truck driver, and countless others in the supply chain. When they spend their wages, they create income for teachers, mechanics, doctors, and others.

This is why consumer spending matters so much for economic health. When households reduce consumption due to economic uncertainty, the immediate effect is lower revenue for firms. Firms respond by producing less, hiring fewer workers, and paying lower total wages, which means less income for households to spend, further reducing consumption. This negative feedback loop can trigger recessions. Conversely, when consumer confidence is high and households spend freely, firms expand, hire workers, pay higher wages, and the positive feedback loop accelerates growth.

Scaling individual choices
While individual consumers make utility-maximising choices and individual businesses make profit-maximising decisions, the aggregate of all these individual decisions creates macroeconomic outcomes.​

When millions of consumers reduce their spending due to economic uncertainty, the aggregate effect is lower total consumption, reduced business revenues, lower investment, and slower economic growth. When governments lower taxes, households have more income to spend, which increases aggregate demand, prompting businesses to expand production and hire more workers. The multiplier effect amplifies these changes—an initial increase in spending creates a chain reaction of income and spending throughout the economy.

Interest rates illustrate this connection perfectly. A central bank raises interest rates to control inflation. Individually, this makes borrowing more expensive for a business considering a factory expansion. Collectively, as thousands of businesses postpone investment due to higher borrowing costs, aggregate investment falls, economic growth slows, and inflation moderates. The macroeconomic outcome emerges from millions of individual microeconomic decisions.

Individual choices by producers and consumers aggregate to determine what the entire economy produces and how. People choose what they want, whatever they think is best for them in the given moment keeping their personal constraints and preferences in mind, and this helps the entire economy choose what to produce, and how much, and using what methods.

How does this happen? The point at which the entire market settles is called an equilibrium. This is the point where the total demand in the economy matches the total supply.

Aggregate demand (AD) is the total amount of all goods and services that all buyers in an economy want to purchase at different price levels. It includes:

  • Consumer spending (households buying groceries, clothes, services)
  • Business investment (firms buying machinery, building factories)
  • Government purchases (roads, schools, defence)
  • Net exports (exports minus imports)

When the overall price level in the economy rises (inflation), people can afford less with their income, so the total quantity of goods and services demanded tends to fall. Conversely, when the price level falls, purchasing power increases, and aggregate demand rises.

Aggregate supply (AS) is the total amount of goods and services that all producers in an economy are willing to supply at different price levels.

In the short run, firms respond to higher prices by producing more (because higher prices mean higher profits). So when the price level rises, the quantity of goods and services supplied tends to increase. When prices fall, firms have less incentive to produce, so aggregate supply falls.

Over the long run, however, aggregate supply is determined by the productive capacity of the economy—the factors of production available (labour, capital, land, entrepreneurship) and the technology used. In this longer view, the price level does not affect how much the economy can fundamentally produce; that is determined by real resources and efficiency.

Macroeconomic equilibrium occurs when aggregate demand equals aggregate supply at a particular price level. At this equilibrium:

  • The total amount consumers, businesses, and governments want to buy matches the total amount firms want to supply.
  • There are no unintended accumulations of inventory (which would push prices down).
  • There are no widespread shortages (which would push prices up).
  • The economy settles at this price level and output level, unless something external changes.

When aggregate demand exceeds aggregate supply: The total spending in the economy is greater than the total output available. Imagine households and businesses want to buy more goods and services than firms can produce. This creates upward pressure on prices because:

  • Firms see strong demand and can raise prices without losing customers.
  • Businesses invest more to expand capacity.
  • Workers may demand higher wages due to tight labour markets.
  • This tends to push the price level upward (inflation).

If this imbalance persists, it can lead to “overheating” of the economy—rapid inflation as the economy bumps against its productive limits.

When aggregate supply exceeds aggregate demand: The total output produced is greater than what people want to buy. Firms end up with unsold inventory and spare capacity. This creates downward pressure on prices because:

  • Firms lower prices to try to sell their excess stock.
  • Businesses postpone investment and lay off workers due to weak demand.
  • Workers have less bargaining power, and wage growth slows.
  • This tends to push the price level downward (deflation or disinflation).

If this imbalance persists, it can lead to recession or stagnation, low growth, rising unemployment, and falling prices as the economy operates below its potential.

Over time, price changes and behaviour adjustments push the economy back toward equilibrium:

  • If demand is too high and inventories are depleting, firms raise prices. Higher prices cool demand (people buy less because it is more expensive) and encourage supply (firms produce more because profit margins are higher). Gradually, demand and supply rebalance.
  • If demand is too low and inventories build up, firms cut prices. Lower prices stimulate demand (people buy more because it is cheaper) and discourage supply (firms produce less because margins shrink). Again, they move toward balance.

In theory, this self-correcting mechanism should prevent persistent shortages or surpluses (this is what economists call “the invisible hand”, a metaphorical description of how the market corrects over‑ and under‑production, over‑ and under‑pricing, and similar imbalances). However, in the real world, these adjustments take time, and other factors (such as government policy, shocks, or expectations) can push the economy away from equilibrium before it settles.

AspectMicroeconomicsMacroeconomics
FocusIndividual consumers, workers, firmsEntire economy, aggregate levels
Key questionsHow do people allocate limited resources? Why do prices change?Why do economies grow? What causes inflation and unemployment?
Key actorsConsumers, workers, businessesHouseholds, firms, governments, financial institutions, rest of world
Unit of analysisUtility, profit, marginal decisionsAggregate demand, aggregate supply, price levels, employment
Difference between Micro and Macro Economics

Modern applications1819
Traditional economic theory provides the foundation for understanding modern economies, which operate through sophisticated systems of banking, credit creation, and financial markets.

In traditional economies, money was often physical (coins and notes) and the money supply was limited by the amount of precious metal a nation possessed. Modern economies operate through a very different system where banks create money through lending: imagine a saver deposits INR 1,000 in a bank, the bank immediately lends most of that money to a business seeking a loan- let’s say INR 900. The business spends that INR 900, which ends up as deposits in another person’s bank account. That second bank then lends 90% of the INR 900, and the process repeats.​ They don’t lend the entire amount because they are required to keep a certain amount in reserve with the central bank. In India, this is called the Cash Reserve Ratio.20

The Cash Reserve Ratio is the percentage of a bank’s total deposits that must be held as liquid cash with the central bank, such as the Reserve Bank of India (RBI). It is a monetary policy tool used by the central bank to manage the money supply, control inflation, and ensure banks have enough liquidity to meet withdrawal demands (that is, the bank should have the money required for a normal amount of withdrawals). Banks cannot use this money for lending or investment, and they do not earn interest on it.

Suppose:

  • The CRR is 10%.
  • A person deposits INR 1,000 in a commercial bank.

The bank must keep INR 100 (10%) as reserves with the RBI, and can lend out INR 900. When that INR 900 is deposited by someone else:

  • The second bank keeps 10% (INR 90) as reserves and lends out INR 810.
  • The process repeats: each round, 10% is held as reserves, and 90% is lent out again.

In theory, the maximum amount of new deposits that can be created from the original INR 1,000 is determined by the money multiplier, which equals 1 divided by the reserve ratio (this is a simplified ‘maximum’ scenario. In practice, banks may be constrained by capital requirements, borrower demand, regulation, and risk management, so the actual expansion of money is usually smaller than the theoretical maximum).

If the reserve ratio (CRR) is 10% (or 0.10), then the money multiplier is 1 ÷ 0.10 = 10.

This means that the original deposit of INR 1,000 can theoretically support up to INR 10,000 in total deposits across the banking system (INR 1,000 × 10 = INR 10,000).

  • Banks may hold extra reserves.
  • People may hold some cash rather than depositing all their money.

This process is called credit creation or the money multiplier effect, where the original INR 1,000 deposit can eventually support INR 10,000 or more in total money supply in the economy. Banks don’t simply lend out existing money; they create “new” money through the lending process. This is why controlling the money supply is central to macroeconomic management.

In conclusion, traditional economic theory, built on scarcity, opportunity cost, and the interaction of supply and demand, gives us a language for understanding economic choices. It does not tell us what ought to be produced or who should benefit, but it clarifies the trade-offs and shows how millions of individual decisions aggregate into the performance of entire economies.

Sources

  1. Lesson summary: Scarcity, choice, and opportunity costs – Khan Academy
  2. Scarcity and Opportunity Cost – LibreTexts, Econ 101: Economics of Public Issues
  3. Production Possibility Frontier (PPF): Purpose and Use – Investopedia
  4. Complete Guide to the Production Possibilities Curve – ReviewEcon
  5. Scarcity, Choice and Opportunity Cost – Physics & Maths Tutor (A‑level notes, PDF)
  6. Factors of Production – Wall Street Prep
  7. Factors of Production: Land, Labor, Capital and Entrepreneurship – Corporate Finance Institute
  8. Microeconomics – Investopedia
  9. Microeconomics course home – Khan Academy
  10. 14.01SC Principles of Microeconomics – MIT OpenCourseWare
  11. Microeconomics – Encyclopedia Britannica
  12. Macroeconomics – Investopedia
  13. Macroeconomics course home – Khan Academy
  14. What is macroeconomics? – Board of Governors of the Federal Reserve System
  15. Macroeconomic and Fiscal Policy – World Bank (Economic Policy topic)
  16. The Circular Flow of Income – Saylor “Economics: Theory Through Applications”
  17. Circular Flow Model: Definition & Examples – Study.com
  18. Multiplier Effect: How Fractional Reserve Banking Creates Money – Management Study Guide
  19. Banking and the Expansion of the Money Supply – Fiveable (AP Macroeconomics)
  20. Cash Reserve Ratio (CRR): Meaning, Objectives & Current CRR – ClearTax